
Figure 2.
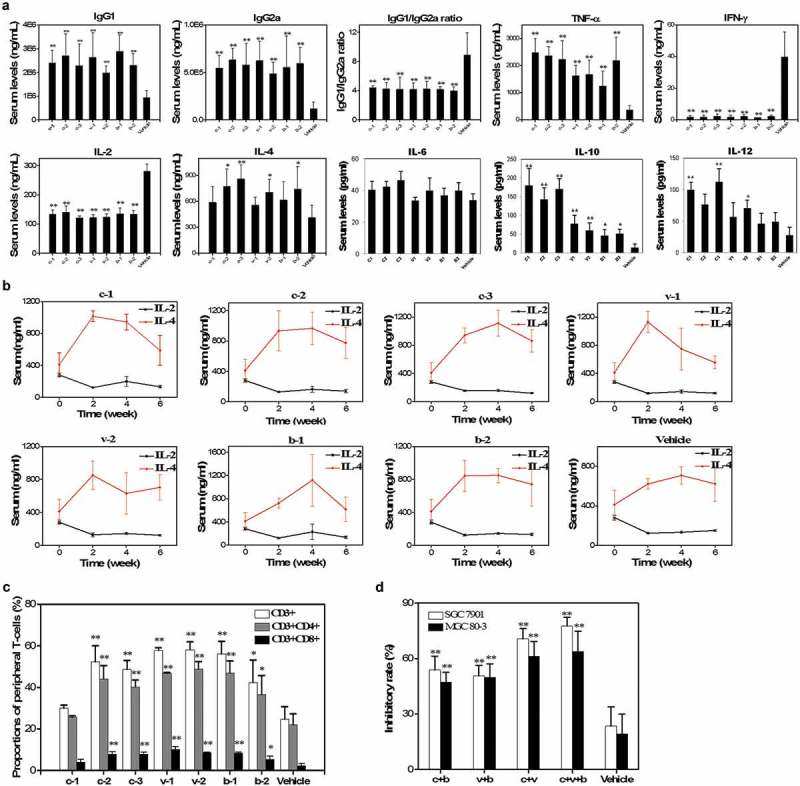
Evaluation of the immune responses and inhibitory effects of splenic T-cells elicited by H. pylori DNA vaccines. (a). Serum IgG1 and IgG2a levels and the relative ratios and concentrations of TNF-α, IFN-γ, IL-2, IL-4, IL-6, IL-10 and IL-12 assessed by ELISA in various groups of immunized mice. (b). Dynamic changing curves of serum IL-2 and IL-4 from 0 to 6 weeks after vaccination determined by ELISA. (c). Subpopulations of peripheral CD3+, CD4+ and CD8+ T-cells in immunized mice evaluated by flow cytometry. (d). Inhibitory rates of H. pylori-activated splenic T-cells on SGC 7901 and MGC 80–3 cell lines cultured in vitro. **, P < 0.01 and *, P < 0.05.