
Figure 1.
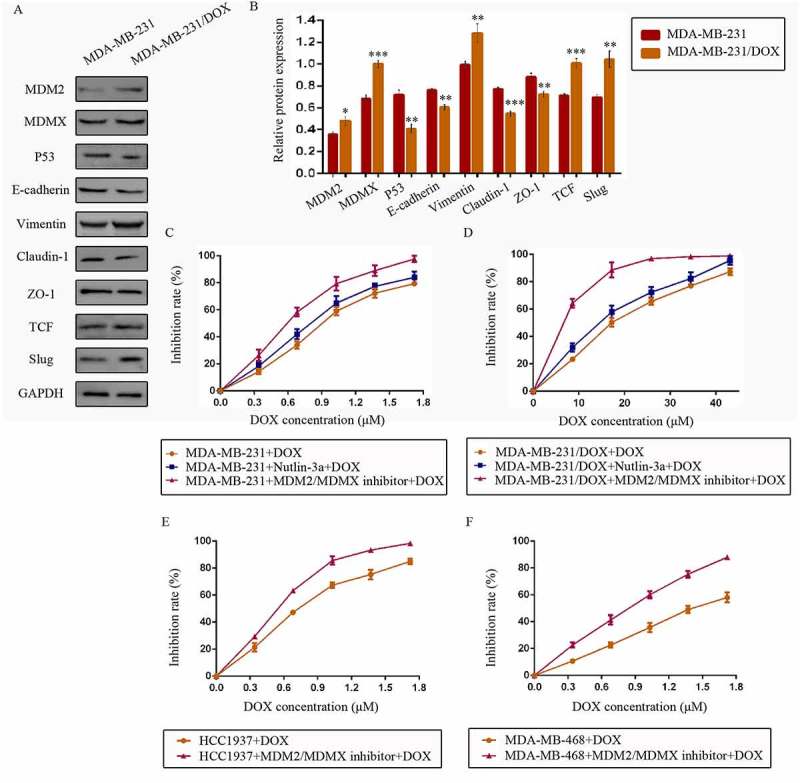
The expression levels of the p53- and EMT-related proteins in drug-resistant cells and the corresponding drug-sensitive cells were determined using western blot analysis. The results are representative of three independent experiments (a) and quantified data are presented as the mean ± SD. *P < 0.05, **P < 0.01, ***P < 0.001 vs. the corresponding drug-sensitive cells (b). GAPDH was used as a loading control. Cells were treated with the indicated agents for 24 h, and cell survival was measured by an SRB assay in order to prove that the MDM2/MDMX inhibitor enhanced DOX-induced cytotoxicity in TNBC cells. The growth curves of specific treatments are shown: MDA-MB-231 treated with DOX alone or in combination with the nutlin-3a or MDM2/MDMX inhibitor (c), MDA-MB-231/DOX treated with DOX alone or in combination with the nutlin-3a or MDM2/MDMX inhibitor (d), HCC1937 treated with DOX alone or in combination with the MDM2/MDMX inhibitor (e) and MDA-MB-468 treated with DOX alone or in combination with the MDM2/MDMX inhibitor (f). The concentrations of nutlin-3a used in MDA-MB-231 and MDA-MB-231/DOX cells were 25.36 µM and 25.69 µM respectively. The concentration of the MDM2/MDMX inhibitor in MDA-MB-231, MDA-MB-231/DOX, HCC1937 and MDA-MB-468 cells was 33.16 nM, 38.28 nM, 36.78 nM and 41.49 nM respectively.