. 2019 Jun 17;8:e46269. doi: 10.7554/eLife.46269

Figure 3. Dynamics and distribution of nuclear SCC1-mEGFP in G1 and G2 phase.

(A) Images of inverse fluorescence recovery after photobleaching (iFRAP) in SCC1-mEGFP cells in G1 and G2 phase (Figure 3—figure supplement 1A). Half of the nuclear SCC1-mEGFP fluorescent signal was photobleached and the mean fluorescence in the bleached and unbleached regions was monitored by time-lapse microscopy. (B) The difference in fluorescence signals between the bleached and unbleached regions was normalised to the first post bleach image and plotted (mean ± S.D., n = 19 per condition). (C) SCC1-mEGFP distribution in the nucleus in G1 and G2 phase. Dynamic and stable populations were estimated using curve fittings from Figure 3—figure supplement 1B,C. Soluble populations were estimated by measuring the reduction in signal intensity in the unbleached area after bleaching (Figure 3—figure supplement 1G). (D) FCS/FRAP estimates of soluble, dynamic and stable nuclear SCC1-mEGFP copy number (see Table 3 for exact values).
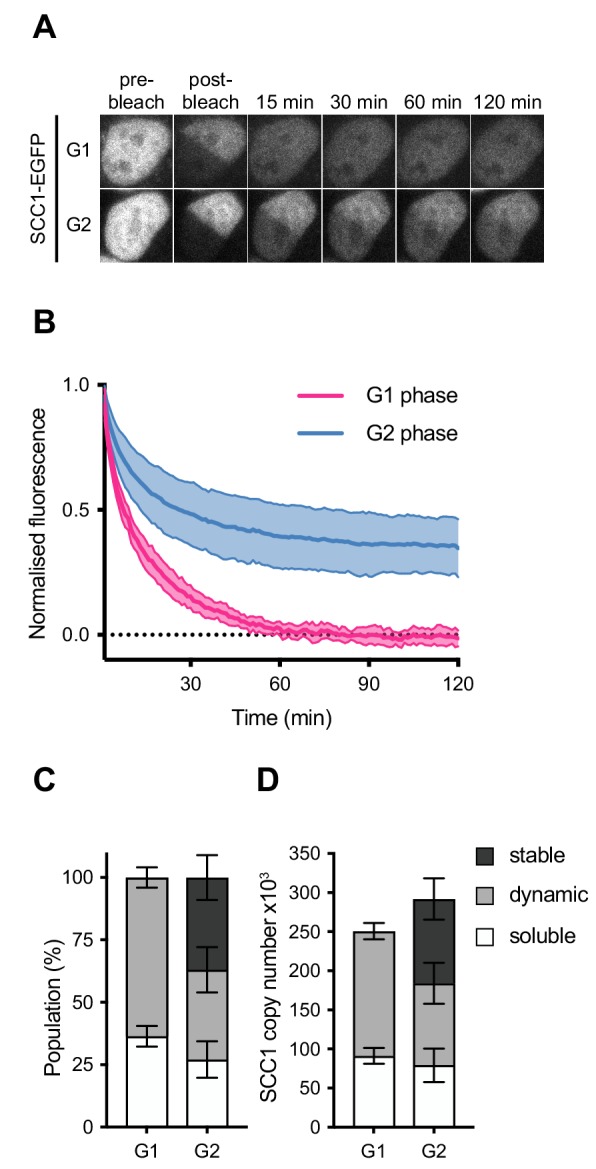
Figure 3.

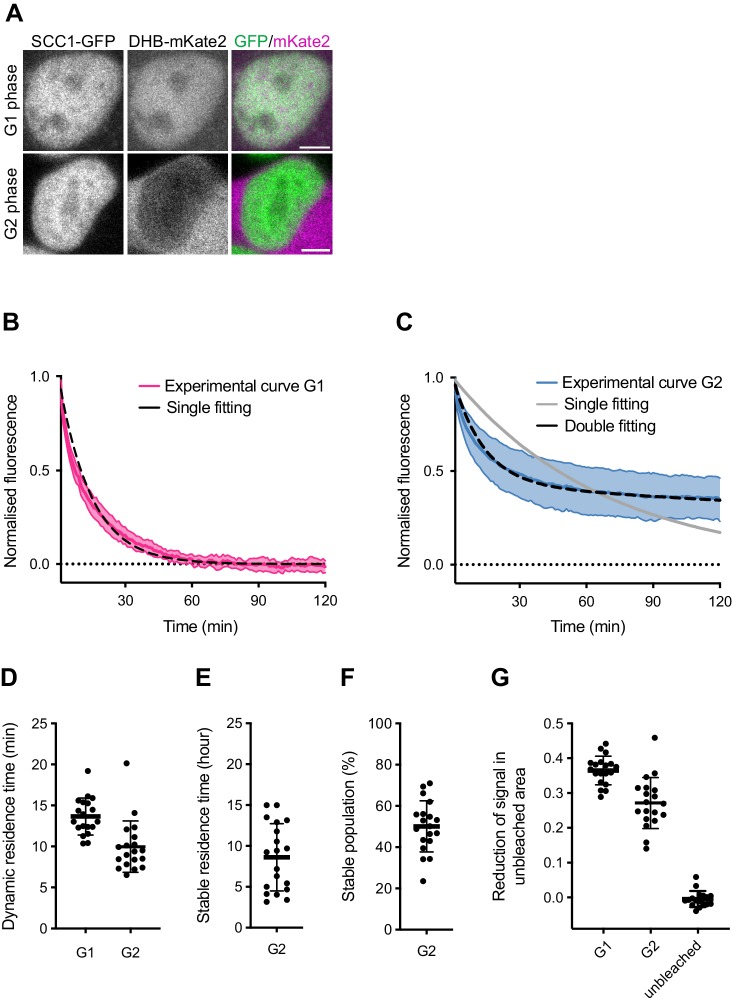
Figure 3—figure supplement 1. Dynamics and distribution of nuclear SCC1-mEGFP in G1 and G2 phase.

Figure 3—figure supplement 1.

(A) Images of SCC1-mEGFP cells in G1 and G2 phase, as distinguished by nuclear (G1) and cytoplasmic (G2) distribution of DHB-mKate2. Scale bar: 10 μm. (B) Curve fitting to experimental iFRAP curves obtained from G1 phase using a single exponential function (dashed black line). (C) Curve fitting to experimental iFRAP curves obtained from G2 phase by a single exponential function (dashed cyan line) and double exponential functions (dashed black line). (D) Residence times of dynamically bound SCC1-mEGFP in G1 and G2 were measured from individual curves by a single exponential function in (B) and by double exponential functions in (C), respectively, and plotted (mean ± S.D.). (E) Residence time of stably-bound SCC1-mEGFP measured from individual curves by double exponential functions in (C) and plotted (mean ± S.D.). Dots indicate individual cells. (F) Population of stably-bound SCC1-mEGFP expressed as a percentage of total chromatin-bound SCC1-mEGFP, measured from individual curves by double exponential functions in (C) and plotted (mean ± S.D.). Dots indicate individual cells. (G) Reduction of fluorescent signals in unbleached area after photobleaching was quantified and plotted (mean ± S.D.). ‘unbleached’ shows the reduction in nuclear fluorescent signal in cells not subjected to iFRAP within the same experiment. Dots indicate individual cells.