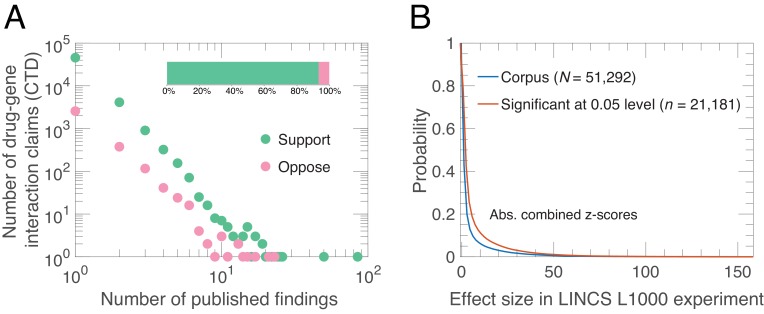
Figure 1. Alignment of drug-gene interaction (DGI) claims reported in the literature with DGI claims from high-throughput experiments.
(A) Our analysis of 51,292 DGI claims (see Supplementary file 1) in the literature revealed 60,159 supporting findings (green) and 4253 opposing findings (pink) in aggregate. These DGI claims co-occurred in both the CTD publication dataset and the LINCS L1000 exerimental dataset. Most claims (45,624) were supported by just one published finding, 4127 claims were supported by two published findings, and the remaining 1541 claims were supported by three or more published findings. Some claims (3154) were both supported and opposed by the published findings, meaning that in addition to the supporting finding(s), there is one or more increase/decrease interactions in the CTD dataset that propose the opposite effect: 2563 claims were opposed by one, 376 by two, and 215 by three or more published findings. Please note that both axes in the main graph are logarithmic. (B) We calculated experimental effect sizes with combined z-scores for the 51,292 DGI triples in the LINCS L1000 dataset. This graph plots the probability (y-axis) versus absolute value of the combined z-score for all triples (blue line) and those that are significant at the 0.05 level (salmon line). Significant in this context means that the drug-gene effect is observed across a range of experiment conditions; the method used to determine significance is described in Materials and methods.


