. 2019 May 29;8:e45571. doi: 10.7554/eLife.45571

Figure 3. Expansion of airway cells in the tumor-initiated lung.

(A) Non-neoplastic alveolar regions from lung sections of saline-, urethane (ethyl carbamate, EC)-, and 3-methyl-1,2-dyhydrobenzo[j]aceanthrylene/butylated hydroxytoluene (MCA/BHT)-treated GFP;CCSP.CRE mice at six months into treatment (n = 8 mice/group). Note the few GFP-labeled cells of saline-treated mice and their increased numbers in carcinogen-treated mice (arrows). See also Figure 3—figure supplements 1 and 2. (B) Juxtabronchial region from lung section of urethane-treated GFP;CCSP.CRE mouse at six months into treatment (n = 22) stained for the alveolar type II cell marker SFTPC. Arrows and legend indicate different phenotypes of extrabronchial GFP-labeled cells. See also Figure 3—figure supplements 35. (C) Merged high-power image of SFTPC and KRT5 co-staining of human lung adenocarcinoma (n = 10) shows significant co-localization of the two markers in a subset of tumor cells (arrows). See also Figure 3—figure supplement 6. CCSP, Clara cell secretory protein; SFTPC, surfactant protein C; KRT5, keratin 5.

Figure 3.

Figure 3—figure supplement 1. Airway-labeled cells in the alveoli of carcinogen-exposed C57BL/6 mice: representative images.

Figure 3—figure supplement 1.

Single-channel microscopy images (endogenous TOMATO and GFP labeling with Hoechst 33258 nuclear stain) of non-neoplastic alveolar regions of GFP;CCSP.CRE mice treated as in Figure 3A.
Figure 3—figure supplement 2. Airway-labeled cells in the alveoli of carcinogen-exposed C57BL/6 mice: data summary.

Figure 3—figure supplement 2.

Data summary (shown as violin plot) from GFP;CCSP.CRE mice treated as in Figure 3A (n = 10/group). P, overall probability, one-way ANOVA. ns and **: p>0.05 and p<0.01 for the indicated comparisons, Bonferroni post-tests.
Figure 3—figure supplement 2—source data 1. Quantification of alveolar GFP+ cells in GFP;CCSP.CRE mice after carcinogen hit.
DOI: 10.7554/eLife.45571.040
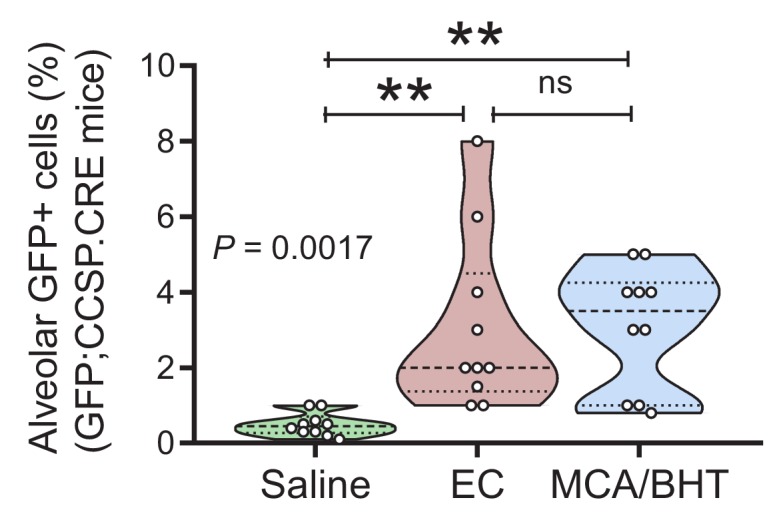
Figure 3—figure supplement 3. Airway-labeled cells in the alveoli of carcinogen-exposed mice express SFTPC.

Figure 3—figure supplement 3.

Single-channel images of non-neoplastic distal lung regions of urethane-treated GFP;CCSP.CRE mice at six months into treatment (n = 22), stained for the lung cell markers Clara cell secretory protein (CCSP), acetylated α-tubulin (TUBA1A), and surfactant protein C (SFTPC). Note the genetic GFP-labeled tumor cells that have lost CCSP and have acquired SFTPC protein marker expression.
Figure 3—figure supplement 4. Airway-labeled cells in environmental-induced lung tumors express SFTPC.

Figure 3—figure supplement 4.

Juxtabronchial regions, alveolar hyperplasias, and tumors (dashed lines) of lungs from urethane-treated GFP;CCSP.CRE mice at six months into treatment (n = 22) stained for lineage marker proteins Clara cell secretory protein (CCSP), acetylated α-tubulin (TUBA1A), and surfactant protein C (SFTPC). Arrows and legend indicate different phenotypes of extrabronchial GFP-labeled cells. a, alveoli; b, bronchi.
Figure 3—figure supplement 5. In vivo bioluminescent detection of the airway lineage in the lungs of saline- and carcinogen-treated mice.

Figure 3—figure supplement 5.

Representative merged bioluminescence/photographic images (left) and data summary (right) of LUC;CCSP.CRE mice (FVB background) before and seven months after saline (one intraperitoneal injection of 100 µL; n = 6) or urethane (one intraperitoneal injection of 1 g/Kg in 100 µL saline; n = 5) treatment. Note that in this model light is emitted exclusively by genetically CCSP-labeled cells over the lungs. Note also the signal decrease in saline- and increase in urethane-treated mice. Data are given as mean ± SD. P, overall probability, two-way ANOVA. ***: p<0.001 for comparison with saline, Bonferroni post-test.
Figure 3—figure supplement 5—source data 2. Quantification of chest bioluminescence signal in LUC;CCSP.CRE mice after urethane exposure.
DOI: 10.7554/eLife.45571.041
Figure 3—figure supplement 6. Human lung adenocarcinomas co-express airway and alveolar markers.

Figure 3—figure supplement 6.

Co-staining of human lung adenocarcinomas for SFTPC and either CCSP (A; n = 10) or KRT5 (B; n = 10) shows absence of CCSP expression and significant co-localization of SFTPC and KRT5 in a subset of tumor cells. CCSP, Clara cell secretory protein; KRT5, keratin 5; SFTPC, surfactant protein C.