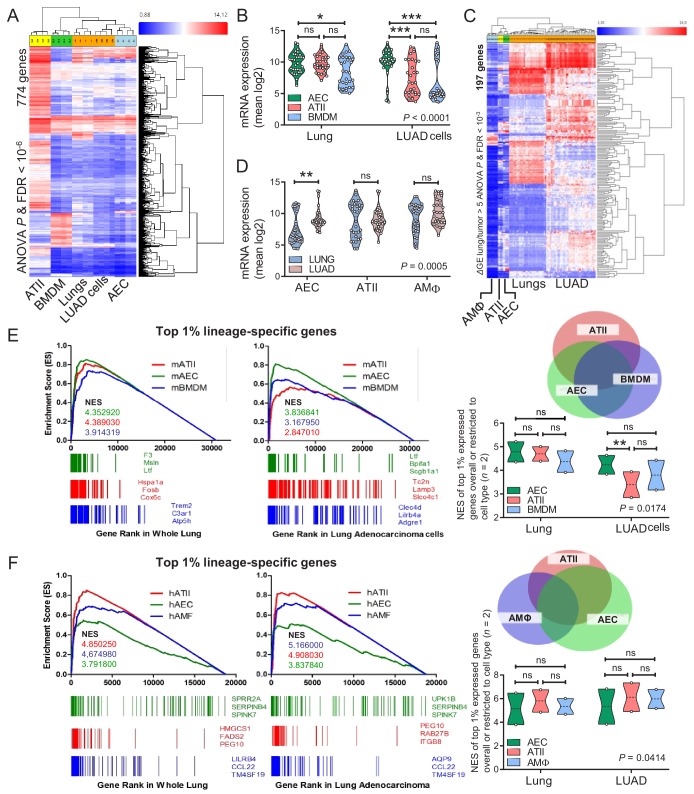
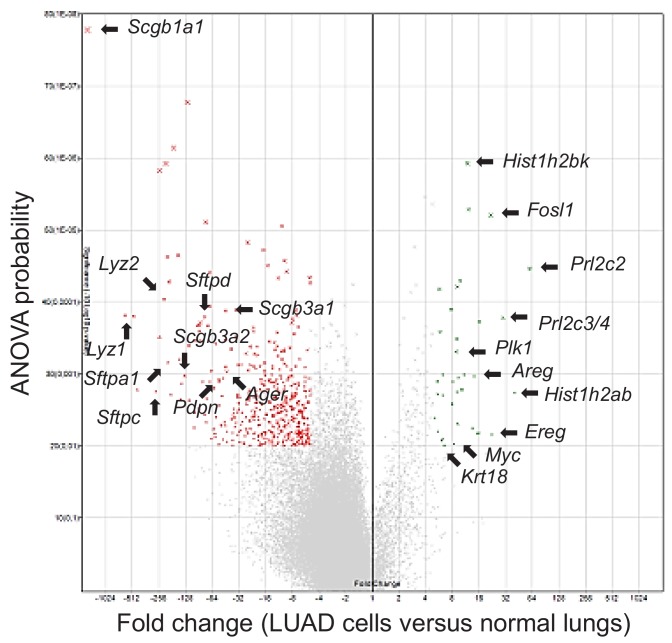
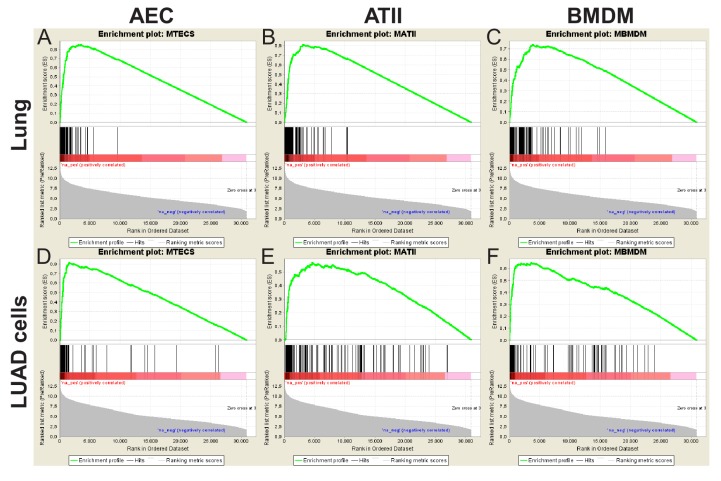
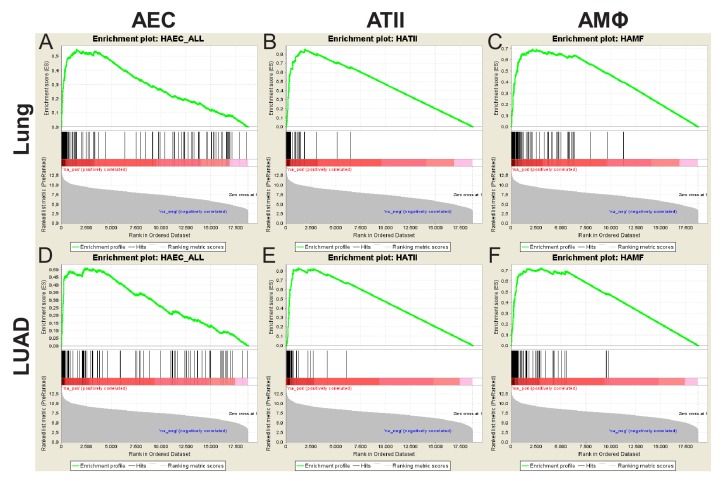
Figure 6. Airway and alveolar signatures in murine and human lung adenocarcinoma (LUAD).
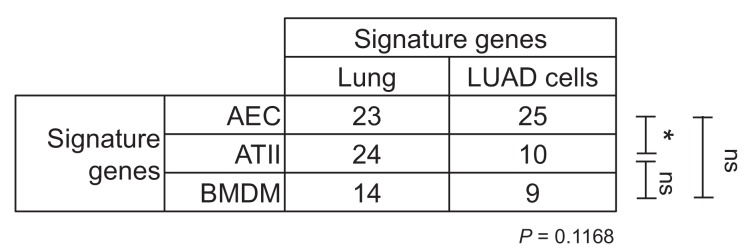
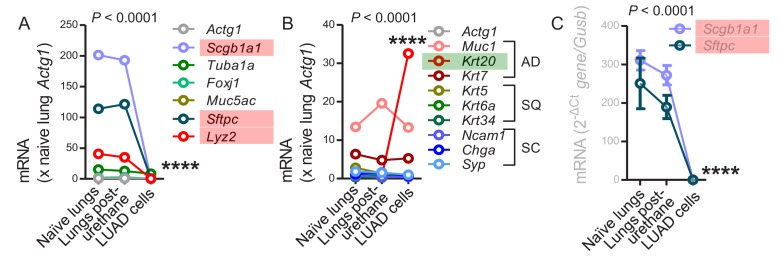
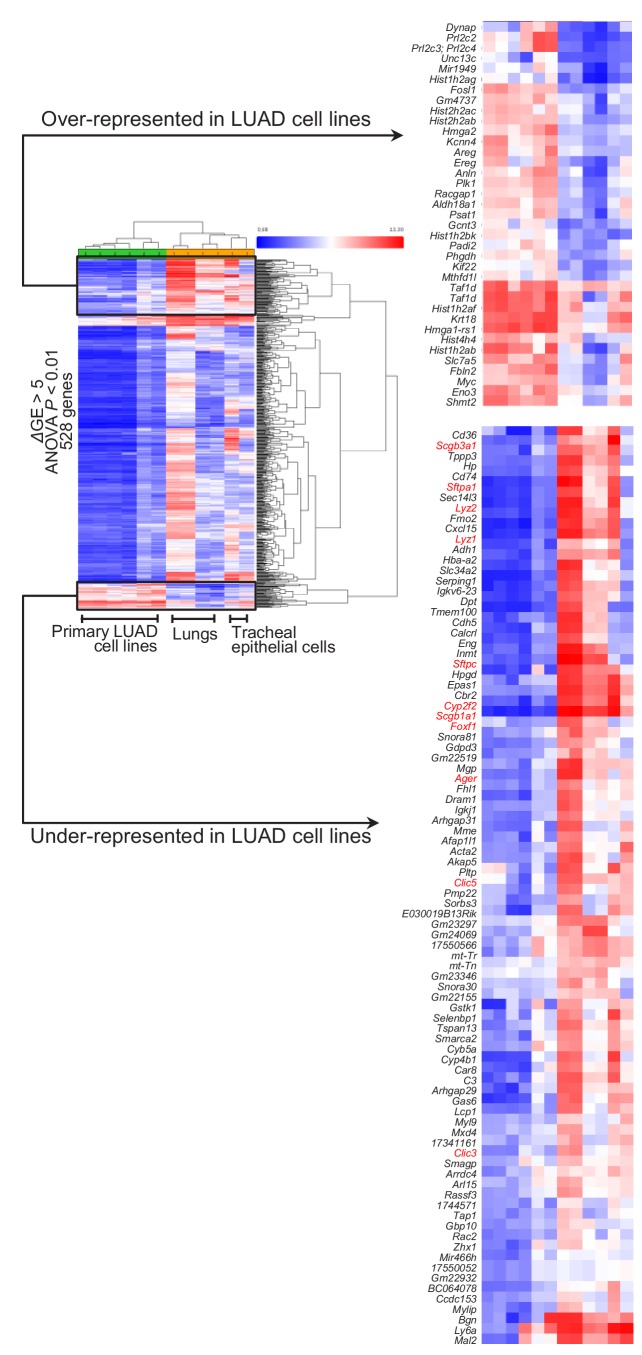
(A, B) RNA of mouse urethane-induced LUAD cell lines, lungs obtained pre- and one week post-urethane treatment, airway epithelial cells (AEC), alveolar type II cells (ATII), and bone marrow-derived macrophages (BMDM) was examined by Affymetrix Mouse Gene ST2.0 microarrays (n = 4/group). (A) Heat map of genes significantly differentially expressed (overall ANOVA and FDR p<10−6) shows accurate hierarchical clustering. (B) Expression of the 30 top-represented transcripts of AEC, ATII, and BMDM in lungs and LUAD cells. See also Figure 6—figure supplements 1–4. (C, D) RNA of human LUAD (n = 40), never-smoker lung tissue (n = 30), primary AEC (n = 5), primary ATII (n = 4), and alveolar macrophages (AMΦ; n = 9) was analyzed by Affymetrix Human Gene ST1.0 microarrays. (C) Heat map of genes significantly differentially expressed (ΔGE > 5 fold) between LUAD and lung (ANOVA and FDR p<10−3) shows accurate hierarchical clustering. (D) Mean expression levels of the 30 top-represented transcripts of human AEC, ATII, and AMΦ in lungs and LUAD. (E, F) Gene set enrichment analyses, including normalized enrichment scores (NES), of mouse (E) and human (F) AEC, ATII, and BMDM/AMΦ signatures (defined as the top 1% expressed genes overall or exclusive to the cell type; n = 2) in mouse and human LUAD transcriptomes shows significant enrichment of the AEC (but not the ATII and BMDM/AMΦ) signature compared with lung (nominal p<0.0001 for all, family-wise error rates FWER <0.01). Gene symbols indicate the top three lagging genes from each signature and shows loss of Scgb1a1 (encoding CCSP) by LUAD. See also Figure 6—figure supplements 5 and 6. Data are given as violin plots. P, two-way ANOVA probabilities. ns, *, **, and ***: p>0.05, p<0.05, p<0.01, and p<0.001 for the indicated comparisons by Bonferroni post-tests. ANOVA, analysis of variance; FDR, false discovery rate.

