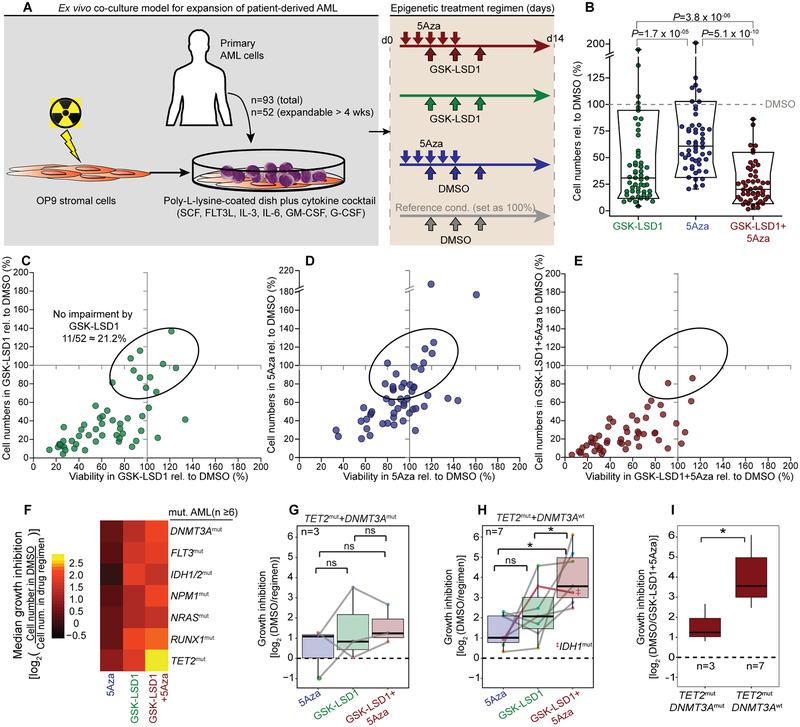
Figure 1.
Ex vivo model for testing epigenetic therapeutics in patient-derived AML reveals TET2mut AML most responsive to combination of LSD1 inhibition with 5Aza treatment. A, Scheme for culturing and epigenetic treatment of primary AML ex vivo. Treatment consisted of ± 5Aza or vehicle for 5 days ± GSK-LSD1 or DMSO on day 3, 5 and 8. Cells were measured on day 14 by flow cytometry for cell viability by propidium iodide (PI) and cell proliferation by absolute numbers of viable cells (PIneg). B, Box-and-whisker plot showing cell proliferation affected by treatment in comparison to the DMSO condition of each primary case (dot). Data is presented with median (bisecting line), 25th – 75th percentile (narrow box), 10th – 90th percentile (box boundaries), 1st – 99th percentile (whiskers) and P-values (Wilcoxon signed-rank test) (n=52). C-E, Scatter plot showing cell viability (x-axis) and cell proliferation (y-axis) for GSK-LSD1 (C), 5Aza (D) and combination therapy (E) in comparison to the DMSO condition set as 100% (grey solid line). Each dot represents a primary case (n=52); dots in ellipse reflect cases not impaired by GSK-LSD1 (n=11). F, Heatmap showing regimen efficacy based on median growth inhibition in AML cases sharing common mutated genes (n ≥ 6 cases per mutation, VAF > 0.2). G, H, Box plots showing growth inhibition in response to drug regimens in TET2mut AMLs with concurrent DNMT3A mutations (G, TET2mut+ DNMT3Amut) and TET2mut+ DNMT3Awt AML (H). (*P ≤ 0.05, paired two-sided Wilcoxon signed-rank test). I, Growth inhibition of TET2mut AML cases with (n=3) and without (n=7) DNMT3A mutations after GSK-LSD1+5Aza combination therapy (*P ≤ 0.05, Wilcoxon signed-rank test).

