Figure 2.
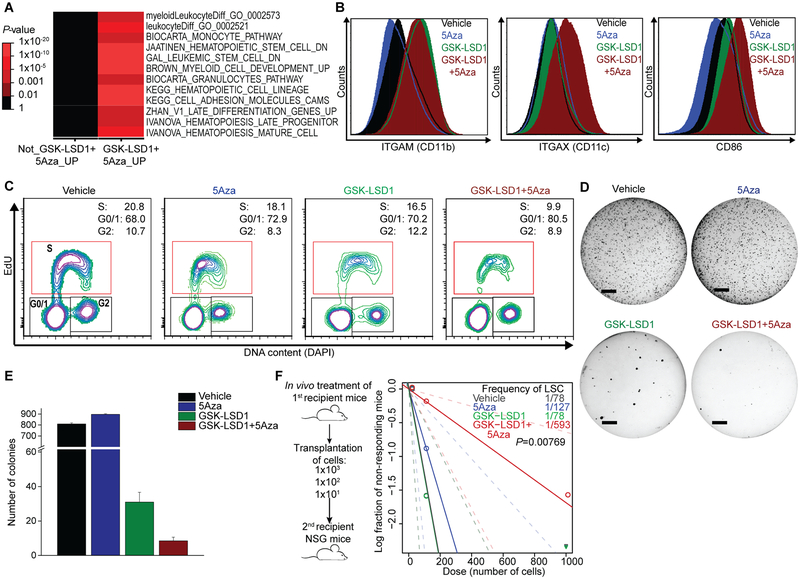
Combination therapy enhances expression of differentiation-associated genes and reduces leukemia-initiating potential in responsive TET2mut AML cells. A, Pathway analysis of RNA-seq-profiled AML cells after treatment of combination therapy compared to vehicle control. B, Expression levels of differentiation markers in AML cells analyzed by flow cytometry. C, Representative flow cytometry plots showing cell cycle analysis with EdU incorporation and DAPI staining. Patient-derived TET2mut AML cells were treated with ± 5Azacytidine for 5 days ± vehicle or GSK-LSD1 on day 3, 5 and 8 with measurement on the following day. D-E, Treated cells were plated in soft agar and colonies were counted after 3 weeks (D, line = 4 mm). Bar graph indicates mean colony numbers (E). F, After in vivo treatment of patient-derived TET2mut cells in first recipient mice with vehicle, 5Aza, GSK-LSD1 and GSK-LSD1+5Aza, a total of 60 secondary recipient mice were transplanted with three cell doses as indicated in scheme (n=5 for each cell dose per treatment). A log-log plot and LSC frequency was calculated using the ELDA tool. The LSC frequency fitted to each dilution series is shown by a solid straight line relating the log10 fraction of non-leukemic mice to the number of cells transplanted into mice. Broken lines show 95% confidence intervals. P-value calculated by chi-squared test for overall evaluation of differences in LSC frequencies between any of the groups.

