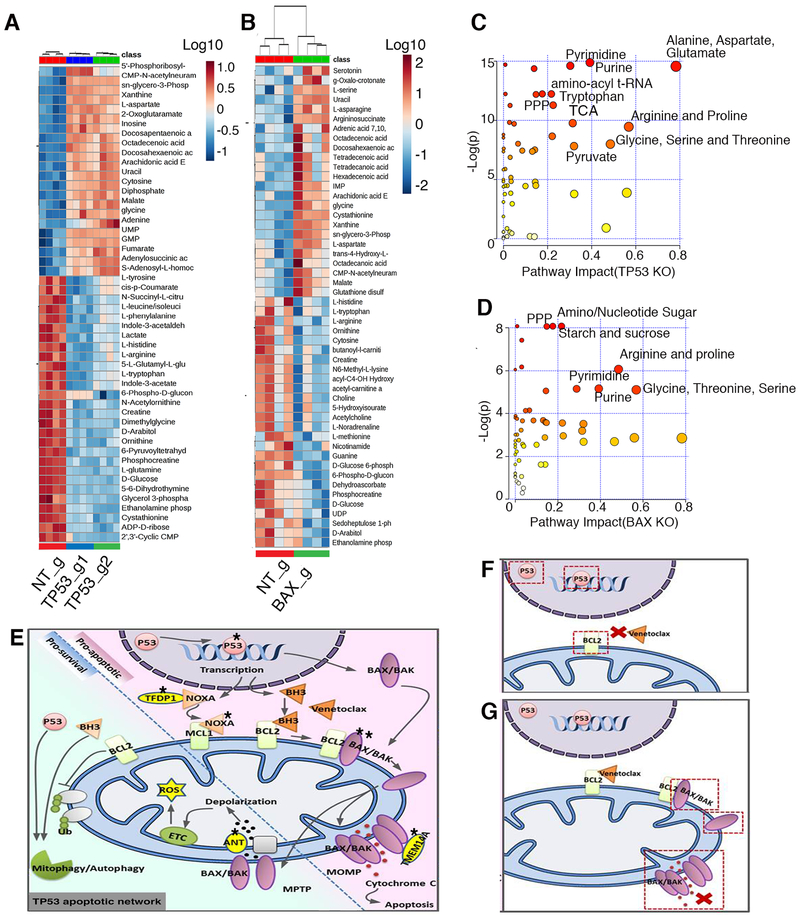
Figure 6. Metabolic changes in TP53 and BAX KO cells are indicative of increased cell proliferation.
A, B. Global metabolomics profile of MOLM-13 TP53 (A) and BAX KO (B) cells. Metabolomic analysis was performed on samples in quadruplicate. Top 50 changed metabolites are shown. C, D. Pathway analysis of metabolites with differential abundance dot plot for MOLM13 TP53 (C) and BAX KO (D) cells. Red to yellow color gradient indicates higher to lower statistical significance, circle size is proportional to the percent of impacted metabolites within the pathway. E. Summary of genes identified by the CRISPR/Cas9 screen impacting mitochondrial homeostasis, energy production, apoptosis and venetoclax response. Star symbol indicates identified genes (TP53 (p53), TFDP1 (DP-1), NOXA (PMAIP1), BAX/BAK, TMEM14A, SLC25A6(ANT3). Mechanisms of venetoclax resistance in cells with inactivation of TP53 (F), or BAX (G). Inactivation of TP53 leads to perturbation in expression of pro-survival proteins, including BCL2, the primary venetoclax target. Inactivation of BAX leads to inability to build effective MOMP during apoptosis, induced by venetoclax.

