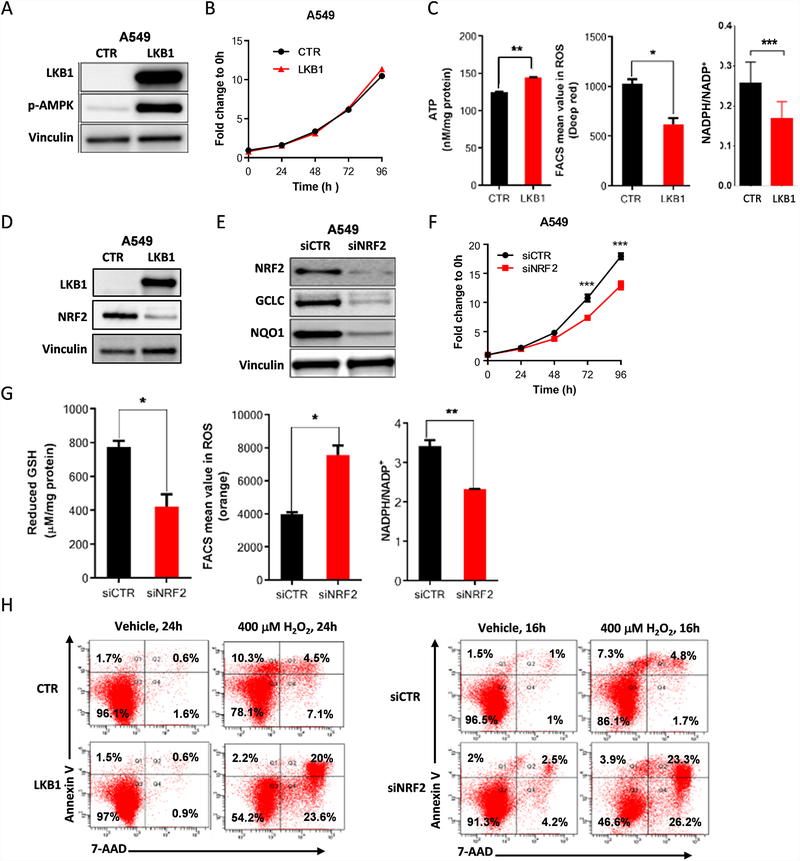
Figure 2.
The NRF2 pathway is modulated in KRAS-mutant LKB1-deficient tumors. (A) Western blot analysis of stable expression of wild-type LKB1 in LKB1-deficient A549 cells and p-AMPK expression used as a functional control of LKB1 overexpression. Vinculin was used as a loading control. (B) Cell proliferation assessed by the SRB assay in A549 cells with LKB1 overexpression, compared with empty vector control cells (n = 5, mean of 3 technical replicates from a representative experiment are shown in the graph). (C) ATP measurement was analyzed using the ATPlite luminescence assay (n = 1), intracellular reactive oxygen species (ROS) levels were monitored using CellRox Deep Red and flow cytometry (n = 3; mean of two technical replicates from a representative experiment are shown in the graph), and the relative NADPH/NADP+ ratio was determined using the NADP/NADPH-Glo assay (n = 1) in A549 cells with LKB1 overexpression, compared with vector control cells. (D) Western blot analysis showing that NRF2 protein expression was higher in LKB1-overexpressing clones than in vector control cells. (E) NRF2 expression was knocked down by siRNA in A549 cells and Western blot analysis was used to determine expression levels of the NRF2 target genes GCLC and NQO1. (F) Cell proliferation was assessed using the SRB assay in NRF2-knockdown A549 cells compared with vector control cells (n = 6; mean of five technical replicates from a representative experiment are shown in the graph). (G) Intracellular GSH levels were analyzed using the GSH-Glo assay (n = 2; mean of two technical replicates from a representative experiment are shown in the graph), ROS levels were measured using CellRox Deep Red and flow cytometry (n = 3; mean of two technical replicates from a representative experiment are shown in the graph), and the relative NADPH/NADP+ ratio was determined using the NADP/NADPH-Glo assay (n = 1; mean of two technical replicates from a representative experiment are shown in the graph) in NRF2-knockdown A549 cells, compared with vector control cells. (H) Apoptosis in A549 cells at 24 hours and 16 hours after treatment with 400μM H2O2 in LKB1 overexpression clones and NRF2-knockdown clones compared with vector control cells, determined by PE-conjugated Annexin-V/7-AAD staining and flow cytometry (n = 1). All data are presented as mean ± standard error of the mean (error bars). Statistical significance: *P ≤ 0.05; **P ≤ 0.01; ***P ≤ 0.001.

