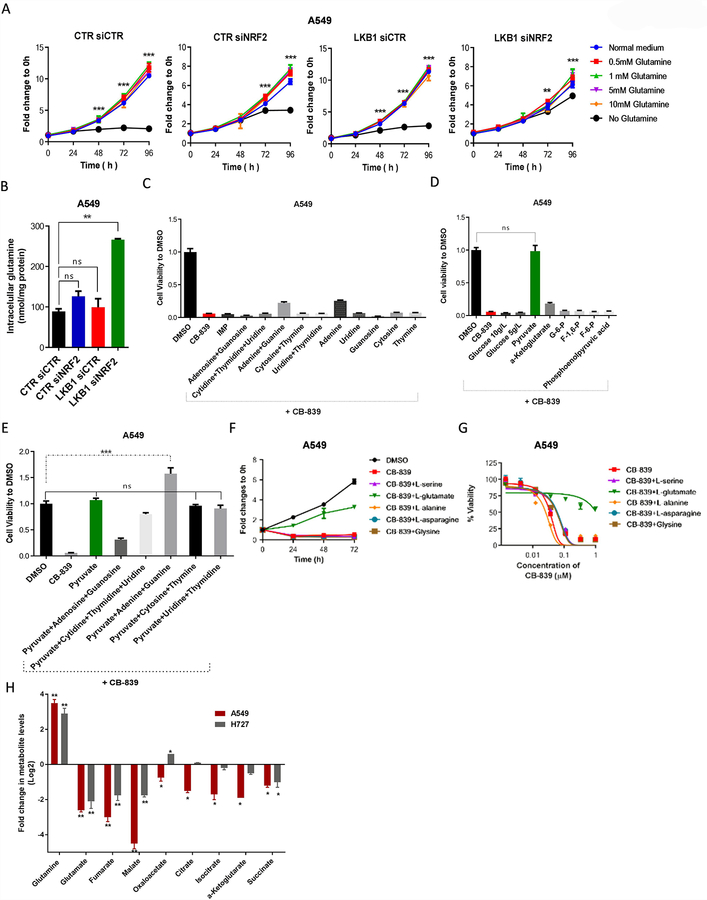
Figure 7.
Glutamate and pyruvate rescue cells treated with glutaminase inhibitors. (A) Cell proliferation, assessed using the SRB assay, in isogenic LKB1 pairs of A549 cells with or without NRF2 knockdown, with different concentrations of glutamine (n = 5 technical replicates per data point). (B) Intracellular concentrations of glutamine at 24 hours after treatment of isogenic LKB1 pairs of A549 cells with or without NRF2 knockdown (n = 5 technical replicates per data point). (C-E) Cell viability of A549 cells treated with 1μM CB-839 and 100μM of exogenous nucleotides (C) and glycolysis and tricarboxylic acid intermediates (D) for 72 hours, as well as (E) nucleotides plus glycolysis intermediates (n = 3 technical replicates per data point). (F) Cell proliferation, assessed using the SRB assay, in A549 cells after treatment with 1μM CB-839 and the indicated concentrations of amino acids (n = 2; mean of five technical replicates from a representative experiment are shown in the graph. (G) Dose response curves of cell viability of A549 cells treated with the indicated concentrations of amino acids in the presence of different concentrations of CB-839 for 72 hours (n = 3; mean of five technical replicates from a representative experiment are shown in the graph). (H) Quantification of TCA cycle intermediates in A549 (GLSi sensitive) and A727 (GLSi resistant) cells treated with 1 μM of CB-839. All data are presented as mean ± standard error of the mean (error bars). Statistical significance: **P ≤ 0.01; ***P ≤ 0.001.

