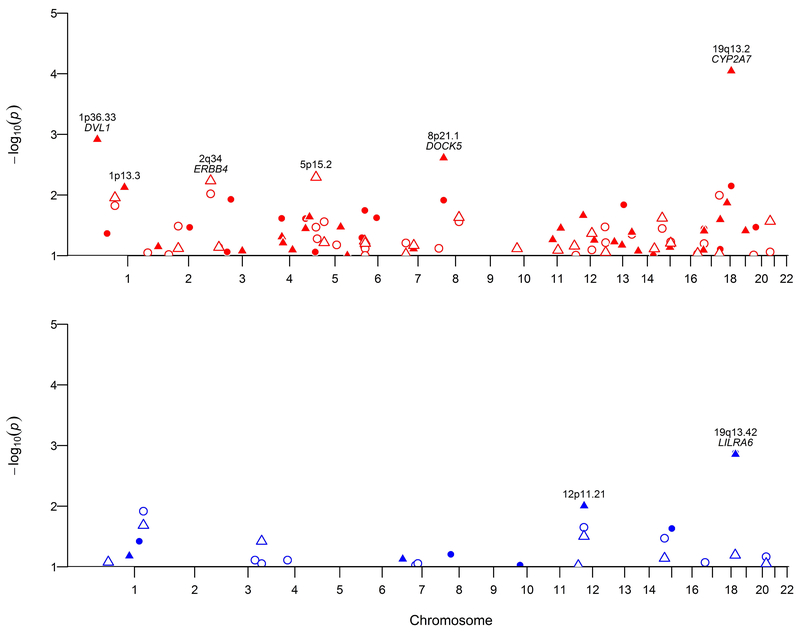
Figure 2. Manhattan plots for association analyses between common CNVR and EOC risk.
Logistic regression was conducted for common CNVRs that were detected by both arrays. Separate analyses for deletions (top figure; red) and duplications (bottom figure; blue) in both the 610k (filled points) and 2.5M (outline points) array sets were conducted for all epithelial risk (circle) and high-grade serous specific risk (triangle).

