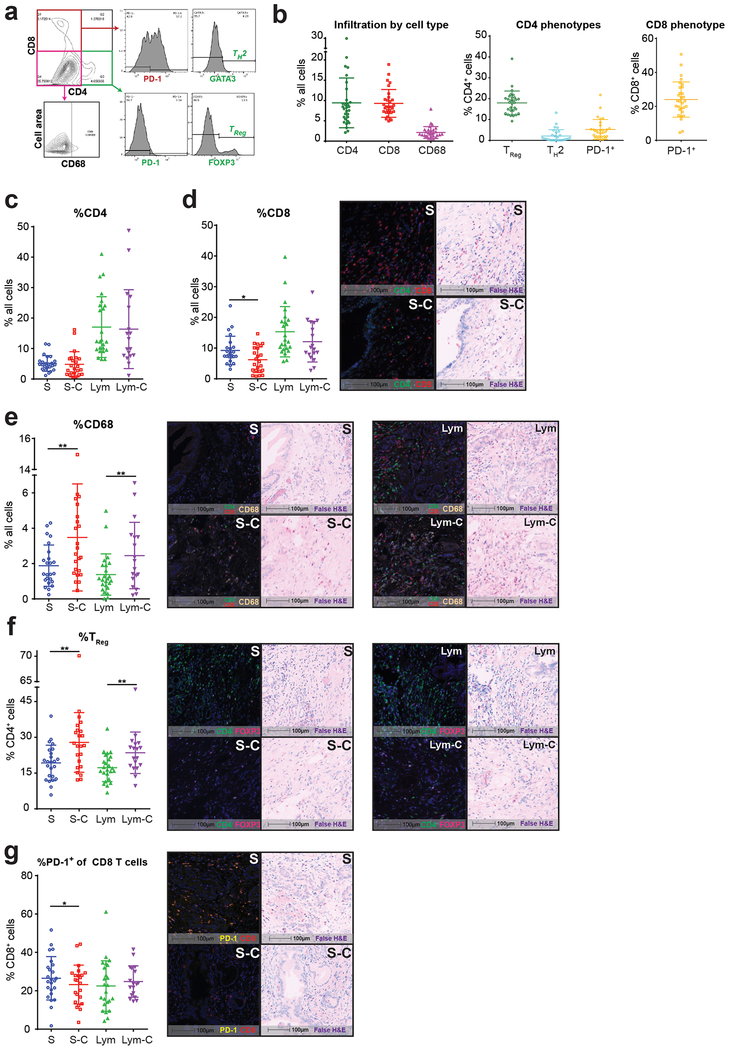
Figure 2: Juxtatumoral areas contain more immunosuppressive elements.
(a) Representative image cytometric output and gating strategy. (b-g) Multiplex IHC phenotypes as % of all cells analyzed (n=30) within each histologic region (S: stroma; S-C: juxtatumoral stroma; Lym: lymphoid tissue (including lymphoid aggregates or lymph nodes); Lym-C: lymphoid tissue with associated carcinoma cell infiltration. (b) Overall T cell and macrophage infiltration throughout entire tumor sections. (c-e) Tumor containing stroma show lower infiltration of CD8+ T cells and higher infiltration of CD68+ macrophages. Scale bars are 100μm. Representative multiplex and matched false H&E images are shown for each significant comparison. (f) Tumor containing stroma and lymphoid tissue have higher TReg infiltration. (g) PD-1 expression on CD8+ T cells is lower in peritumoral stroma. Paired student’s t-tests; * p<0.05, ** p<0.01

