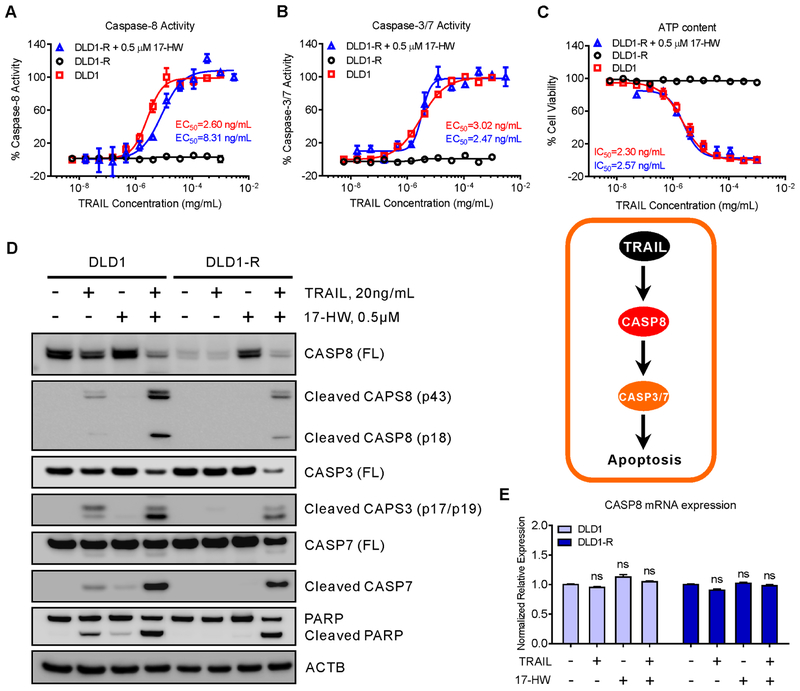
Figure 1.
TRAIL resistance in the DLD1-R cells that was overcome by treatment with 17-HW.
(A-C) Dose-response curves of TRAIL in the presence or absence of 0.5 μM 17-HW on the activities of caspase-8 (A), caspase-3/7 (B), and ATP content of cell viability (C) in TRAIL-sensitive colon cancer DLD1 cells and TRAIL-resistant DLD1-R cells. (D) Western blot of CASP8 full-length (FL), cleaved CASP8, CASP3, cleaved CASP3, CASP7, cleaved CASP7, and PARP after treatment of DLD1 and DLD1-R cells with 20 ng/mL TRAIL in the presence or absence of 0.5 μM 17-HW for 8 hours. ACTB (beta-actin) acts as the loading control. (E) Real-time PCR is showing the CASP8 mRNA expression in DLD1 and DLD1-R cells treated with 20 ng/mL TRAIL in the presence or absence of 0.5 μM 17-HW for 8 hours. The data ware normalized to the GAPDH mRNA level of each sample. All curves represent best fits for calculating the IC50 and EC50 values, and all values represent the mean ± SEM (n = 3 replicates). Western blot picture was shown as one of three repeated experiments. Statistical analysis was performed using two-tailed t-test.

