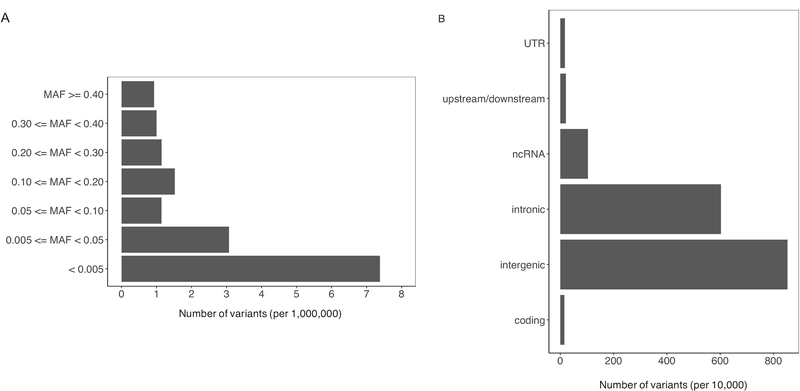
Figure 1. Minor allele frequency (MAF) and functional annotation of PanC4 imputed variants.
A, MAF distribution of imputed variants passed all quality control filters showed that majority of these variants had a MAF < 0.05. B, Imputed variants were annotated into six functional groups by ANNOVA, among which intergenic (52.7%) and intronic (37.2%) variants were the two largest groups.

