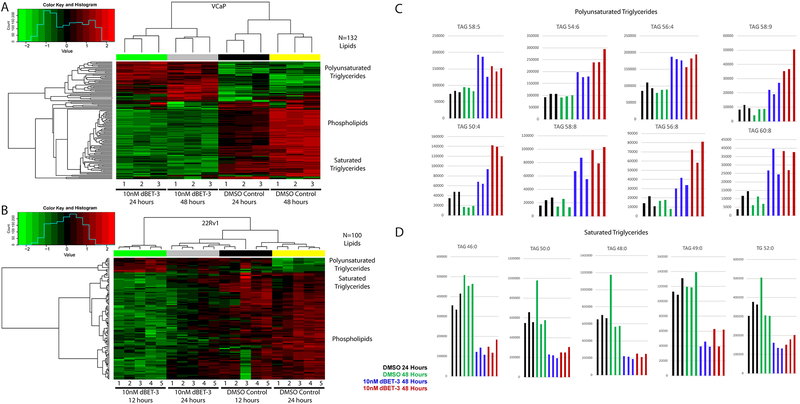
Figure 4: Decreased fatty acid metabolism in BET-degrader treated cells.
Heat map visualization of significantly altered lipid species (p<0.05, FDR corrected) in cells treated with 10nM dBET-3 or DMSO control for either 24 and 48 hours in VCaP (A – 132 lipid species) or 12 and 24 hours in 22Rv1 (B – 100 lipid species). Columns represent replicate samples and rows refer to distinct lipid species. Shades of red and green represent elevation and reduction of the lipids, respectively, relative to median lipid levels. Plots of the polyunsaturated (C) and saturated (D) triglycerides altered in VCaP cells. Black = DMSO control treated cells at 24-hour time point; Green = DMSO control treated cells at 48 hour time point; Blue = 10nM dBET-3 treated cells for 24 hours; Red = 10nM dBET-3 treated cells 48 hours. Columns represent replicate samples. TAG = triacylglycerol, TG = triglyceride.

