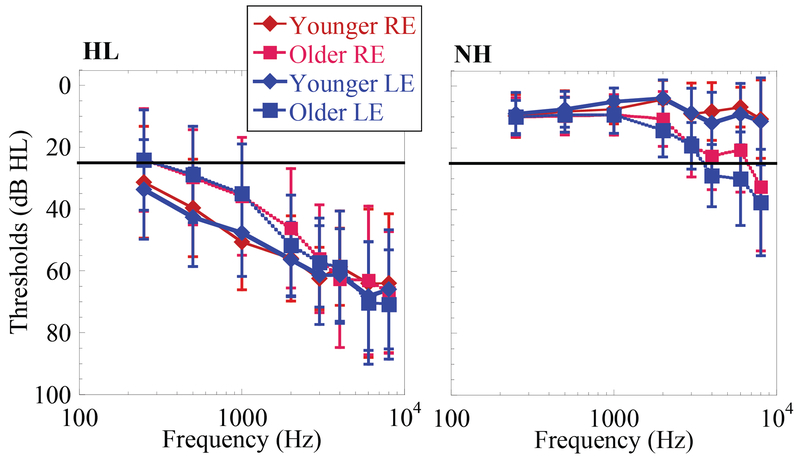
Figure 1.
Audiometric thresholds obtained in younger (diamonds) and older (squares) participants, red and blue lines designating right ear (RE) and left ear (LE) respectively, with hearing loss (HL) in the left column and normal hearing (NH) in the right column. Solid black line represents criteria for normal hearing threshold (25 dB HL). Hearing thresholds in dB HL (abscissa). Frequency in Hz (ordinate). Error bars show +/− 1 standard deviation from the mean.

