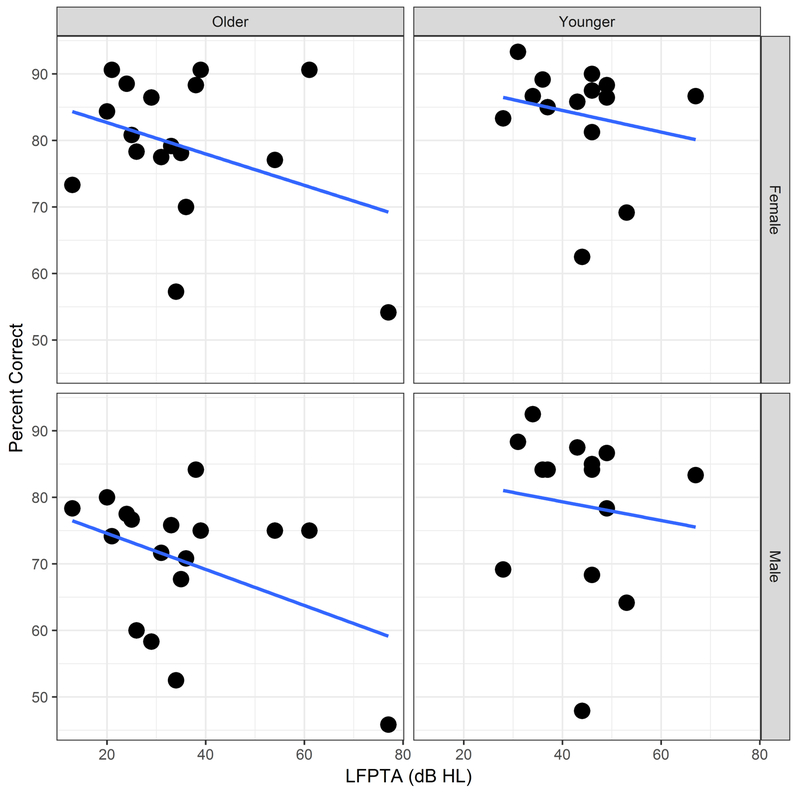
Figure 6.
Overall accuracy (percent correct scores) as a function of LFPTA (dB HL), divided by older group (left column), younger group (right column), female talker’s materials (top row), male talker’s materials (bottom row). Circles represent individual participants for each data set. Solid lines represent linear regression fits.

