
Figure 3.
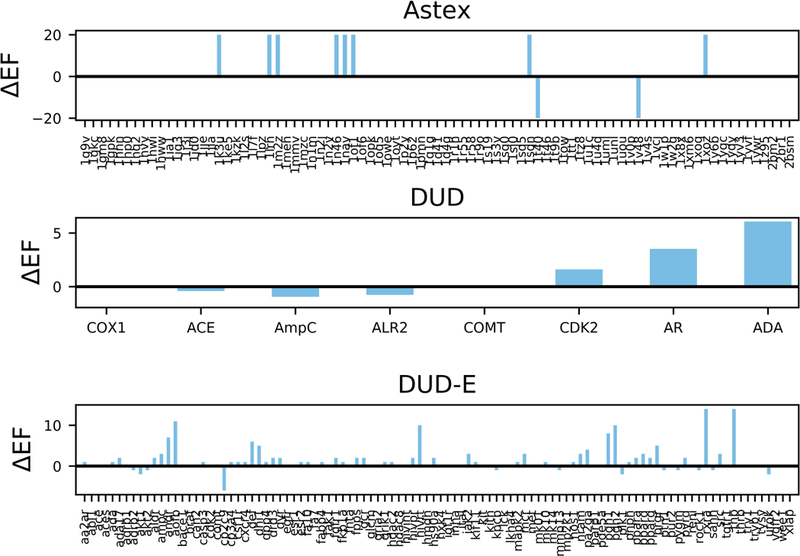
Top 5% enrichment factor enhancement of individual receptors. This figure illustrates the difference between the combined Z-score’s top 5% enrichment factor and the raw docking score’s top 5% enrichment factor for each receptor. The y-axis is the enrichment factor difference (ΔEF) between the two methods, where the length of the bar is a measurement of relative improvement. A positive ΔEF represents a larger improvement of the enrichment factor by the combined Z-score based ranking. If both the combined Z-score and the docking score had an identical enrichment factor, no bar is shown in the figure.