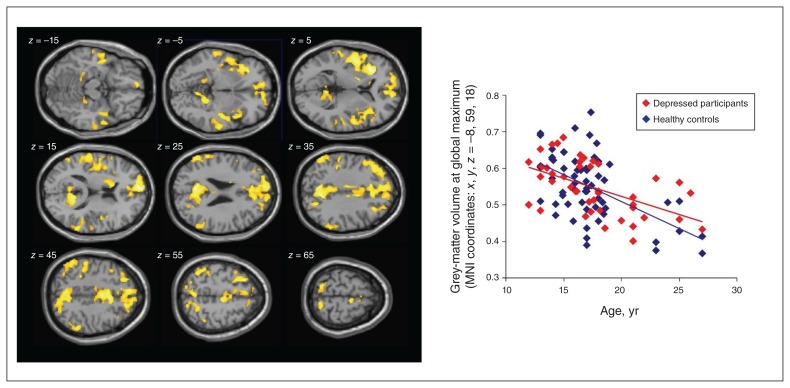
Fig. 1.
Left: Results of the whole-brain regression analysis over the entire group of participants (n = 103); p < 0.001 at the voxel level, pFWE < 0.05 at the cluster level. Right: Correlation of individual grey-matter volume (estimated relative concentration) and age at the global maximum of the age effect, with depressed participants and healthy controls in different colour coding. FWE = family-wise error; MNI, Montreal Neurological Institute.

