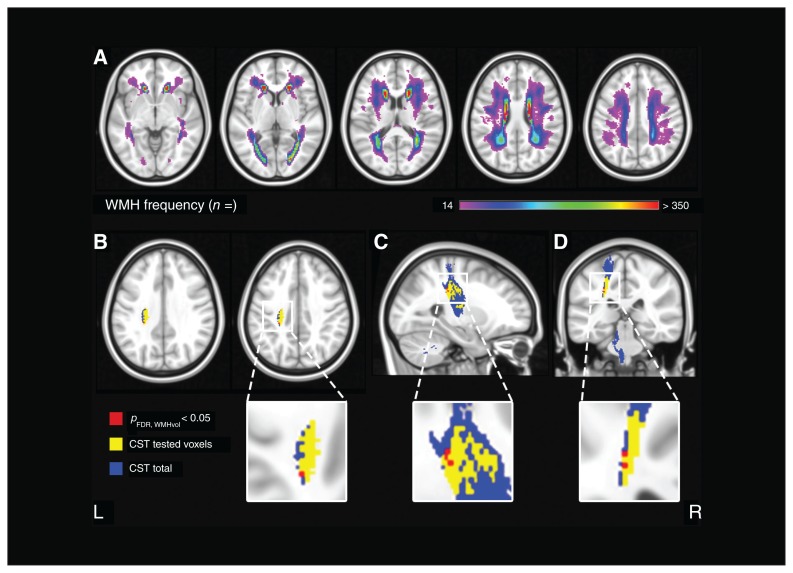
Fig. 2.
Voxel-based lesion–symptom mapping: lesion prevalence map and results. (A) Voxel-wise lesion prevalence of white matter hyperintensities in the study population, projected on the Montreal Neurological Institute 152 T1 template. A minimum threshold of 14 participants with damage in a given voxel was applied; z-coordinates: −5, 5, 15, 25, 35. Voxel-based lesion–symptom mapping results for the Geriatric Depression Scale score, shown in (B) axial, (C) sagittal and (D) coronal planes. Significant voxels after correction for multiple comparisons, age, sex and normalized total white matter hyperintensity volume are shown in red (settings: Brunner–Munzel test; FDR q < 0.05). Significant voxels were located in the corticospinal tract. Regions of interest were derived from the Johns Hopkins University diffusion tensor imaging atlas with a probability threshold of 10%. The corticospinal tract derived from the Johns Hopkins University atlas is shown in blue; the voxels included in the voxel-based lesion–symptom mapping analysis (i.e., damaged in ≥ 14 participants) are shown in yellow. Coordinates: sagittal: x = −25; coronal: y = −32; axial: z = 33, 38. CST = corticospinal tract; FDR = false detection rate; WMH = white matter hyperintensity.

