Figure 2.
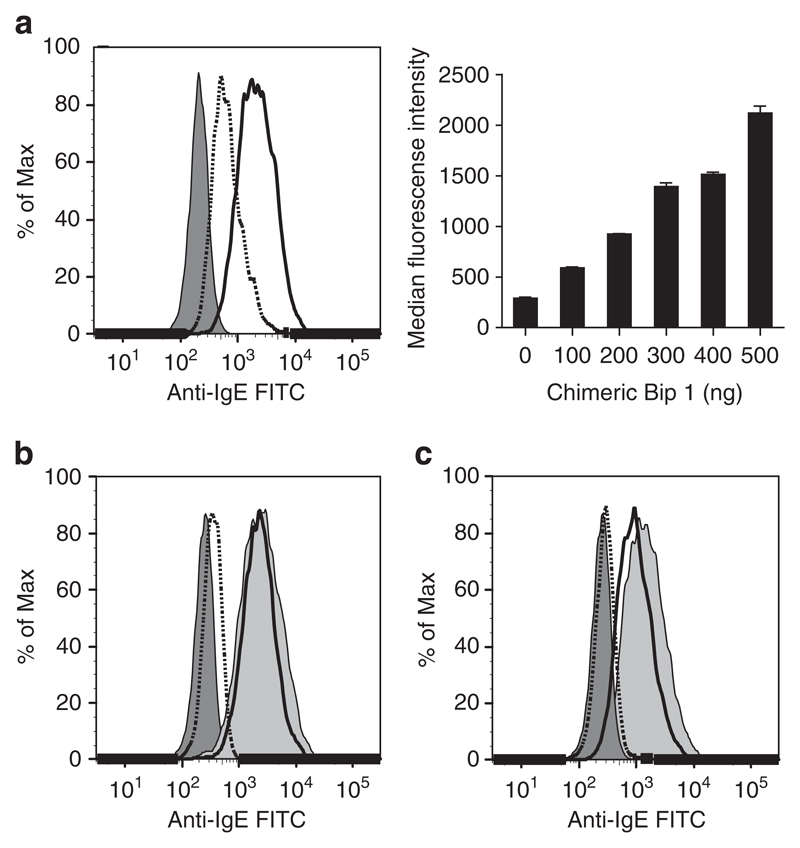
Binding of monomeric CB1 to CD23. (a) FACS histogram left panel, EBV-B cells were incubated with CB1 at the amount of 100 ng (dotted line), 500 ng (solid line) or phosphate buffered saline (PBS) (dark gray filled). Right panel, bar graphs show dose-dependent (x-axis: ng) increase in binding (y-axis: median fluorescence intensity) of CB1 to CD23 on EBV-B cells. Results are displayed as means±s.d.’s (b) FACS histogram of cells, which had been pre-incubated with anti-CD23 antibody (dotted line), matched isotype control antibody (solid line) before addition of CB1. Cells incubated with PBS (dark gray filled) or CB1 without pre-treatment (light gray filled). (c) Histogram of cells exposed to CB1 that was pre-incubated with anti-human IgE (dotted line) or a matched isotype control (solid line). Controls (PBS and CB1 without pretreatment) are as in (b).

