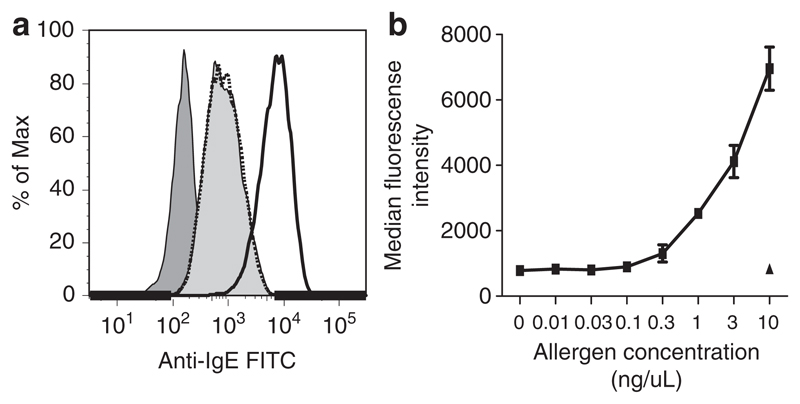
Figure 4.
(a) FACS histograms of anti-IgE-stained EBV-B cells incubated with CB1–Bet v 1 immune complexes crosslinked with rabbit anti-Bet v 1 IgG (solid line), CB1 alone (light gray filled), CB1 with Phl p 5 plus rabbit anti-Bet v 1 IgG (dotted line) or PBS alone (dark gray filled). (b) dose dependency of anti-IgE staining when the concentration of Bet v 1 (filled squares) in the immune complexes with CB1 and rabbit anti-Bet v 1 IgG is increased. The filled triangle marks the intensity of anti-IgE staining for the highest concentration of Phl p 5. Results are displayed as means of duplicate measurements ±s.d.’s.

