
Fig. 2.
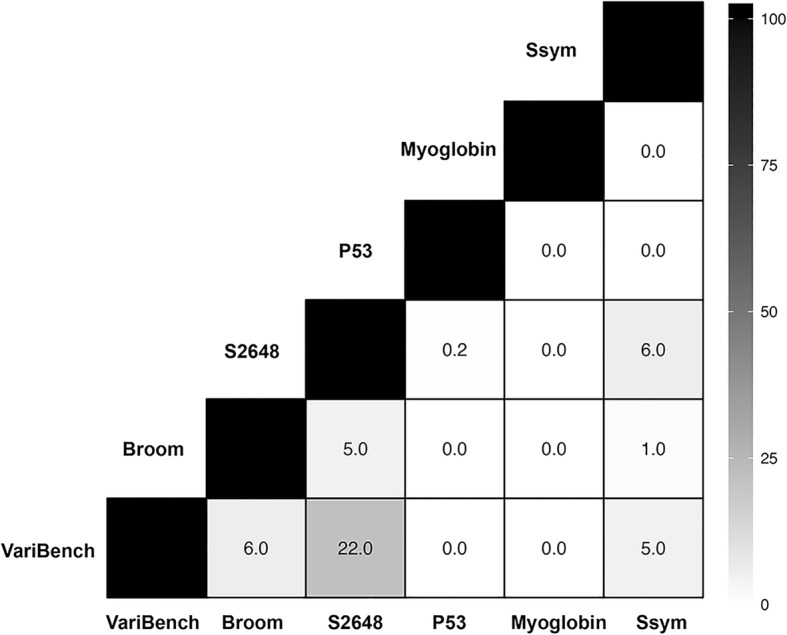
Analysis of the overlap between the single-site variant data sets. Each cell reports the percentage of the common mutations between the two corresponding data sets
Official websites use .gov
A
.gov website belongs to an official
government organization in the United States.
Secure .gov websites use HTTPS
A lock (
) or https:// means you've safely
connected to the .gov website. Share sensitive
information only on official, secure websites.
Analysis of the overlap between the single-site variant data sets. Each cell reports the percentage of the common mutations between the two corresponding data sets