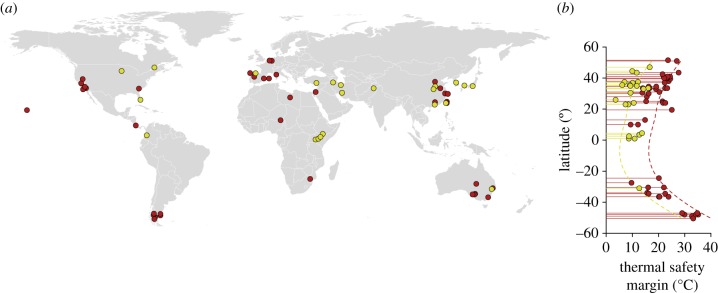
Figure 5.
Predicted vulnerability and resilience to ongoing global warming can change considerably depending on the organization level used to characterize the thermal performance curve. (a) Collection sites for the lizards (red) and insects (yellow) included in the dataset. (b) Thermal safety margins, estimated as the difference between CTmax and the average temperature of the warmest month, differ by roughly 9.1°C between curves obtained for running speeds and intrinsic rates of increase. (Online version in colour.)

