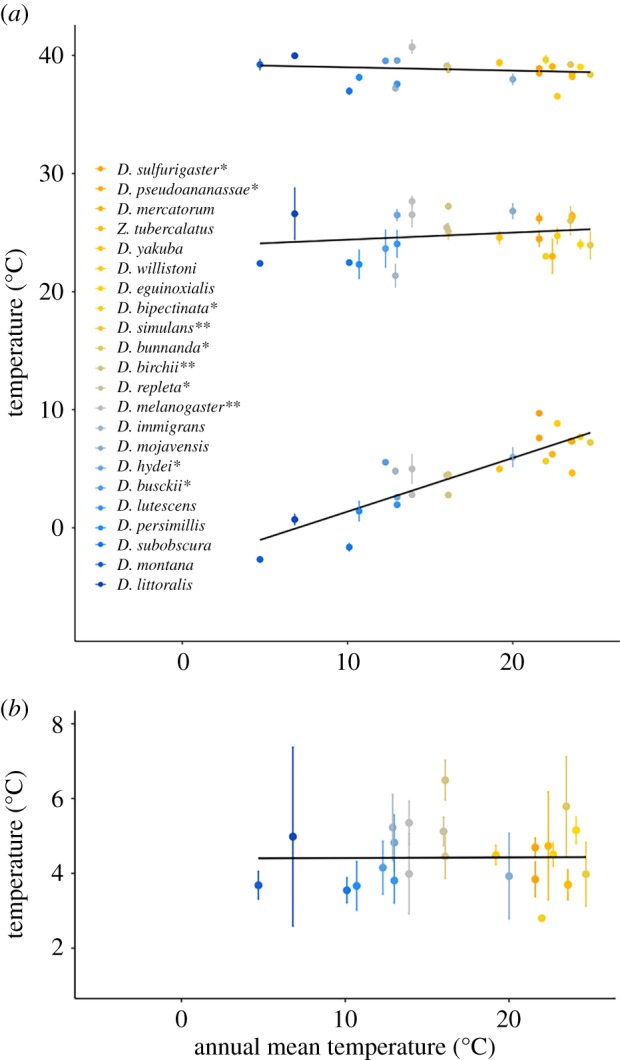
Figure 3.

(a) The thermal limits (CTmin and CTmax) and the calculated thermal optimum (Topt) for all 22 species reared at 19/20°C as a function of annual mean temperature, showing that only CTmin exhibits a strong correlation to environmental temperature. The colour of each symbol corresponds to the mean absolute latitude of that species' range (orange for low and blue for high latitude). * indicates species included from [7] and ** indicates species included in both studies. Z. tubercalatus, Zaprionus tubercalatus. (b) The calculated breadth of thermal performance (Tbreadth) as a function of annual mean temperature shows no relationship with annual mean temperature. (Online version in colour.)
