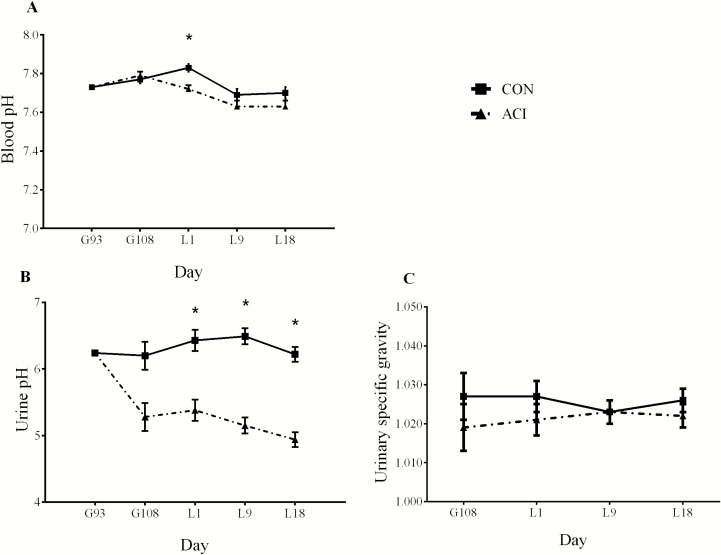
Figure 2.
Effect of dietary cation-anion difference (DCAD, [Na + K – Cl]) on blood pH (A), urine pH (B), and urinary specific gravity (C) in gestating and lactating sow. Values were provided as least square mean and standard error, n = 11. Two dietary treatments were CON (control diets were corn-soybean meal based with a calculated DCAD of 170 and 226 mEq/kg during late gestation and lactation, respectively) or ACI (acidogenic diets had a DCAD 100 mEq/kg lower than the control diets). *Denotes difference (P < 0.05) between CON and ACI.

