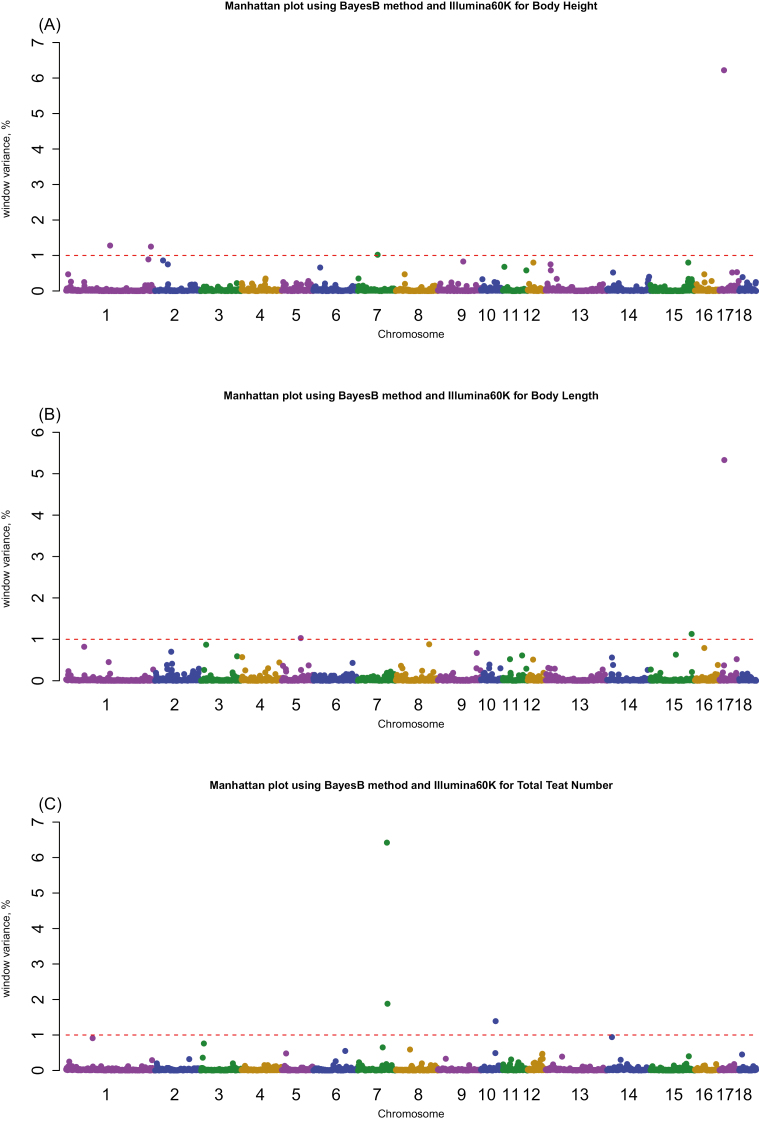
Figure 1.
Manhattan plots of the results of Bayesian GWAS (BayesB with π = 0.99) on 18 porcine autosomes for 3 exterior traits. The y-axis represents the percentage variance within each 1-Mb genomic region, and the x-axis represents the chromosomal location of each window. The red dotted horizontal lines indicate the threshold of the 1-Mb window variance, which was set at >1.0% to identify associations within traits: (A) body height, (B) body length, and (C) total teat number.

