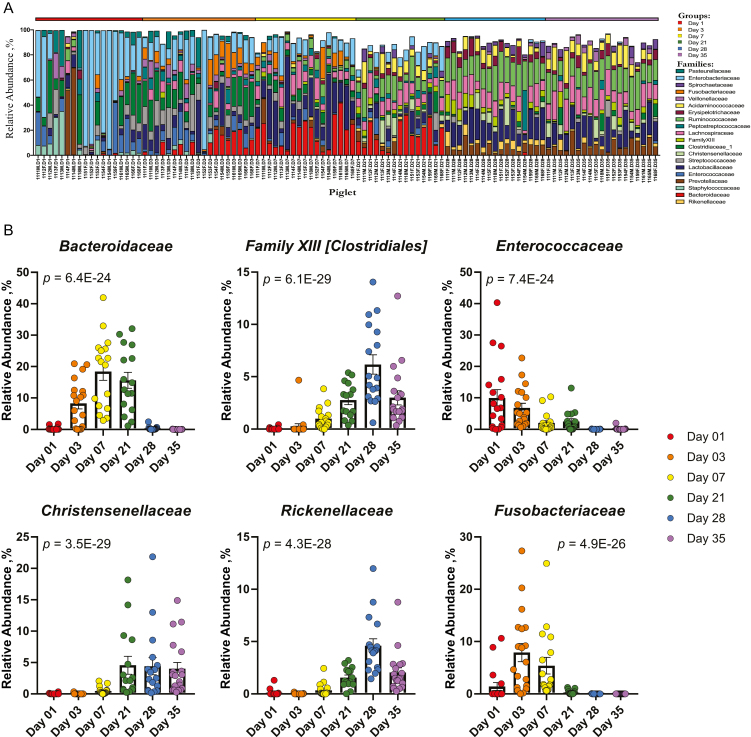
Figure 4.
Taxonomic composition and differentially abundant bacteria. Relative abundances of (A) ASVs by family in piglet fecal samples and (B) top 6 differentially abundant families. P-values with FDR correction are shown for each differentially abundant family and were calculated using a linear mixed effect regression model with repeated measures, controlling for piglet (n = 20).

