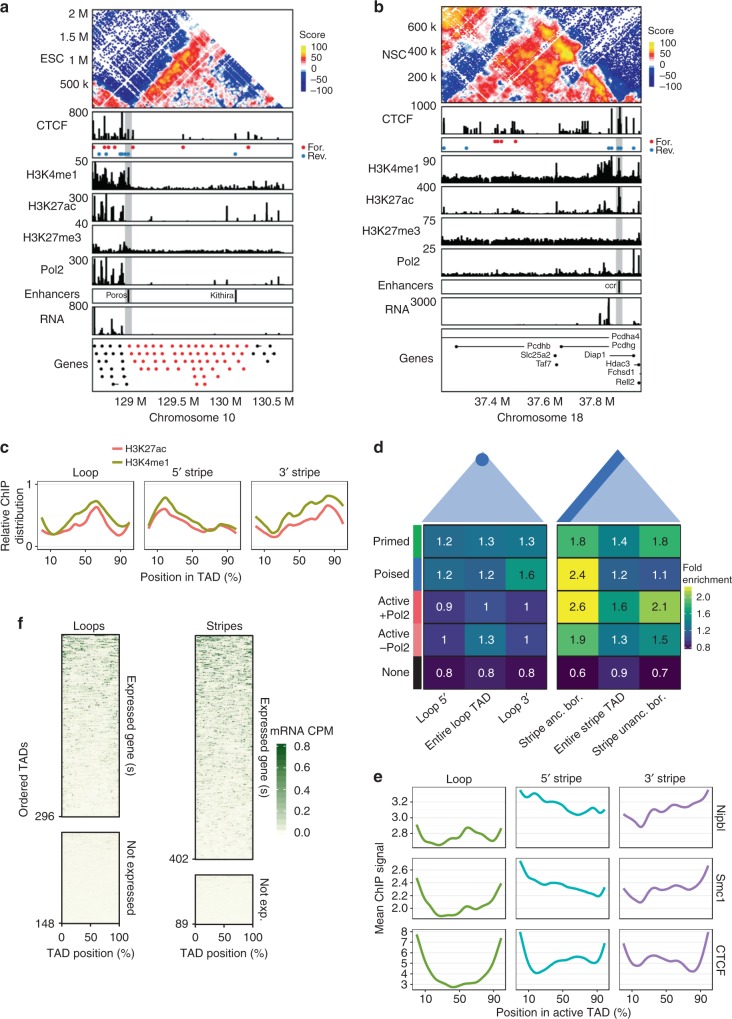
Fig. 3.
Lineage-appropriate enhancers and cohesin loading, not transcription, define stripe TAD polarity. a Hi-C contact map for a 2 Mb region around the Olfactory (Olf) gene cluster on chr10 in ESCs. Also shown is ChIP-seq data (CTCF, H3K4me1, H3K27ac, H3K27me3, Pol2), CTCF motifs at bound sites (annotated as before), RNA-seq data and the locations of the known Olf enhancers Poros and Kithira. Only the TSSs of the genes in the region are shown for clarity, with Olf TSSs coloured in red. Note, the cluster is located at the end of the chromosome, hence the abrupt lack of Hi-C data in the image. b Hi-C contact map for a 700 kb region around the Protocadherin (Pcdh) beta and gamma clusters on chr18 in NSCs. Epigenomic tracks as in a, including the known Pcdh enhancer ccr. c Scaled ChIP-seq signal distributions of enhancer histone marks (H3K4me1, H3K27ac) across active ESC TAD classes. d ChromHMM was used to define genomic segments into Primed (H3K4me1), Poised (H3K4me1, H3K27me3), Active (H3K4me1, H3K27ac ± Pol2) and None in ESCs. The enrichment of these segments with respect to the TAD borders of loop (left panel) or stripe domains (right panel) was then calculated using ChromHMM OverlapEnrichment (see also the section “Methods”). Fold enrichment values are shown. Borders were defined as a 60 kb region of the TAD and 5′ and 3′ stripe domains were oriented and grouped into anchored (anc.) or unanchored (unanc.) borders. e Distribution of ESC RNA-seq signal (counts per million) in 5 kb bins across scaled loop and stripe TADs calculated using deepTools. TADs were ordered according to the mean expression within the TAD (see the section “Methods” and Fig S3h). f Distribution of the mean ChIP-seq signal for Nipbl, Smc1, and CTCF across size-scaled and classified ESC TADs of the A compartment. Note, the signal was not scaled to allow comparison between TAD classes

