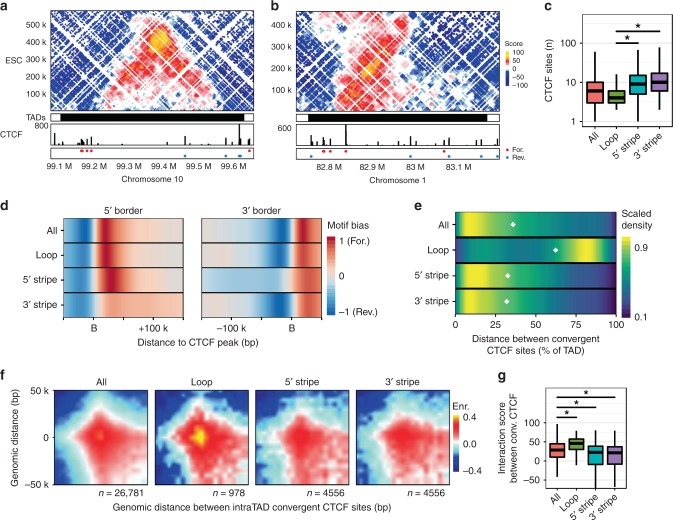
Fig. 4.
CTCF occupancy and connectivity are key determinants of stripe TAD architecture. ESC Hi-C contact maps for (a) a 550 kb region on chr10 representative of a loop domain and (b) a 450 kb region on chr1 representative of a 5′ stripe domain. TAD calls, CTCF ChIP-seq data, and motifs at peaks are shown as before. c Distribution of the number of CTCF-binding sites in classified ESC TADs. Central bar represents the mean and whiskers and boxes indicate all and 50% of values, respectively. KS test *p < 0.001. d Distribution of bound CTCF motifs within 50 kb outside and 100 kb inside of TAD borders, separated into 5′ and 3′ borders (‘B’ on the x-axis). Colour scale represents the difference in density distribution of forward and reverse motifs. e Density distribution of distances between convergent CTCF motifs within TAD classes as a proportion of TAD size. White diamonds indicate median distances. f Aggregate Hi-C contact maps around pairs of intra-TAD convergent CTCF sites in ESCs. Pairs have a minimum interaction score of 40 within a 50 kb region. Number of pairs shown below each plot. g Quantification of interaction scores between convergent CTCF sites shown in (f), Box plot as in c, KS test *p < 0.001

