
Figure 6.
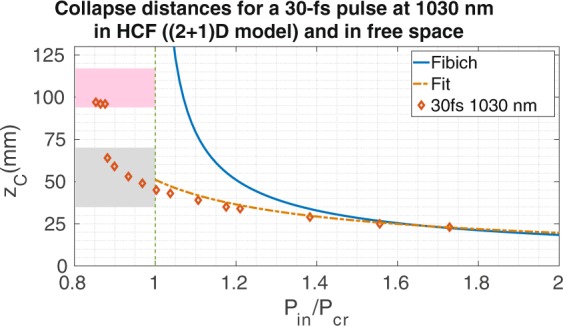
We represent the collapse distances of the EH11 mode as a function of the input power for a HCF with core radius 150 μm. The markers are the collapse distances obtained from (2 + 1)D simulations for a 30-fs pulse at 1030 nm, the solid line shows the collapse distances predicted by Fibich’s formula in free space and the dashed line corresponds to the fit obtained from the (1 + 1)D model (Eq. 2). The gray and pink areas for these parameters go from 35 to 70 mm and from 94 to 117 mm, respectively.