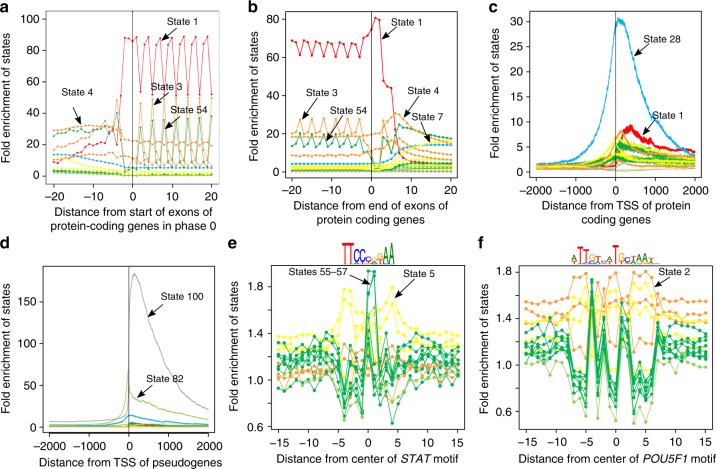
Fig. 3.
Conservation state positional enrichments. Plots of positional fold enrichments of conservation states relative to a start of exons of protein coding genes in phase 0, b end of exons of protein coding genes and c, d TSS of c protein coding, and d pseudogenes genes. Positive values represent the number of bases downstream in the 5’ to 3’ direction of transcription, while negative values represent the number of bases upstream. Enrichments relative to gene annotations are based on a genome-wide background. The subset of states included in panels (a)–(d) were the states that had at least a 3 fold enrichment at some position within ±2 kb from the anchor point. e, f Also shown are positional plots relative to the central nucleotide of a set of instances of e STAT and f POU5F1 motifs. The subset of states included in (e), (f) are the states that had an enrichment of at least 1.5 for some position within ±15 bp from the center nucleotide of either motif. Enrichments for motif instances were computed relative to the portion of the genome scanned for regulatory motifs in ref. 37, which excludes coding, 3′UTRs, and repeat elements. Additional position enrichment plots can be found in Supplementary Fig. 11

