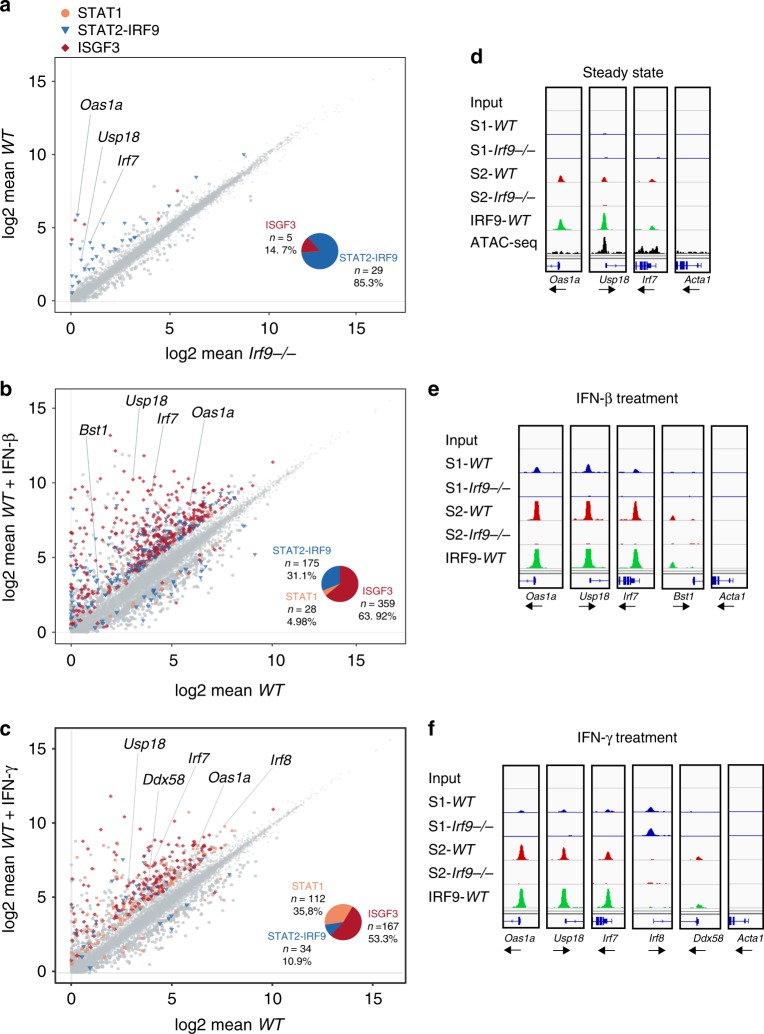
Fig. 2.
IFN-induced gene expression and STAT complexes in BMDM. a–c panels on the left. Scatterplot linking RNA-seq (n = 3) with ChIP-seq (n = 2) data (BMDM). Differentially expressed genes (log-fold change (lfc) > 1, padj < 0.05) between Irf9−/− and WT untreated (a), WT untreated versus WT IFN-β (b), or WT untreated versus IFN-γ-treated (c) BMDM are shown. Genes associated with complexes containing at least one of the ISGF3 subunits (STAT1, STAT2, and IRF9) according to ChIP with the respective antibodies are color-coded as follows. Blue triangles: STAT2–IRF9; red diamonds: STAT1, STAT2, and IRF9 (ISGF3); beige squares: STAT1 only. The pie chart inserts show the relative proportions of genes associated with STAT2–IRF9, ISGF3, or STAT1 dimers. Panels on the right d–f. Representative browser tracks of the ChIP-seq experiments shown in a–c). Data from untreated (d), IFN-β (90 min; e), or IFN-γ- (90 min; f) treated BMDM derived from wild-type (WT) and Irf9−/− (IRF9−/−) mice are shown (scale 0–150). Individual tracks represent binding of STAT1 (S1/blue), STAT2 (S2/red), and IRF9 (green). Tracks are shown for ChIP-seq and control input, as well as regulatory chromatin sites from ATAC-seq for untreated BMDM, derived from data in ref. 18

