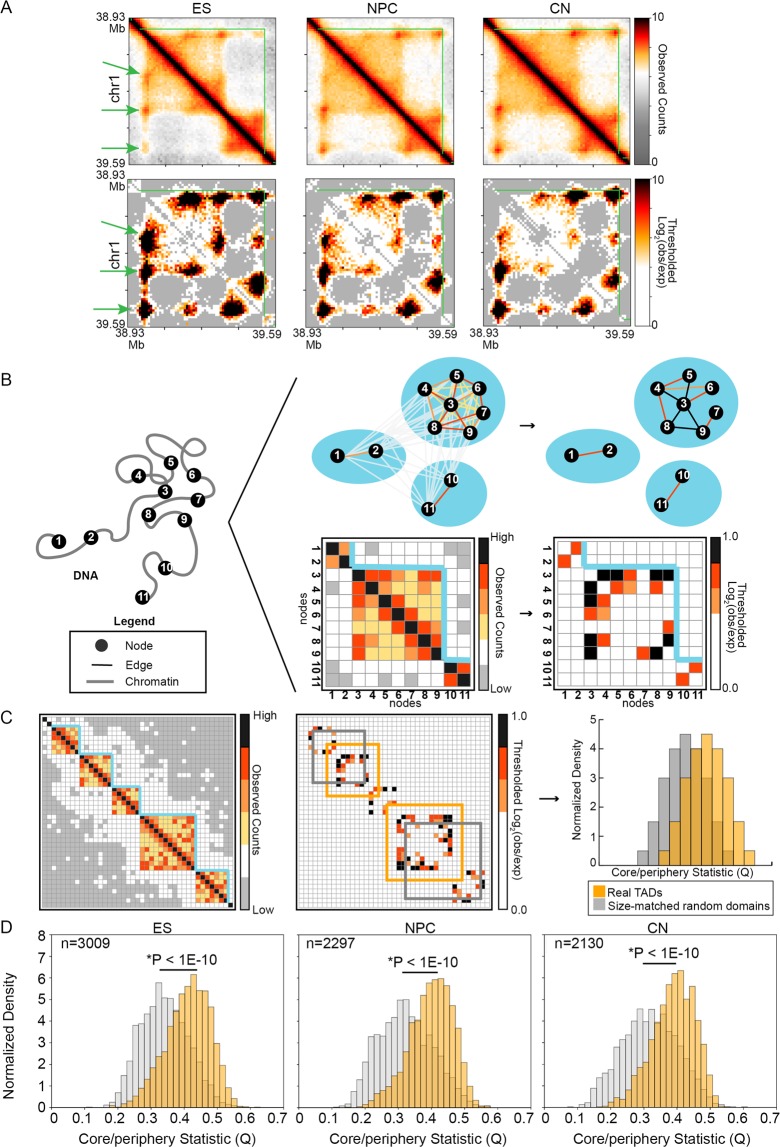
Figure 1.
Genome folding within topologically associating domains (TADs) can exhibit mesoscale core-periphery network structure. (A) Relative interaction frequency (Observed) and background-corrected interaction frequency (Observed/Expected) Hi-C heatmaps for a given TAD in mouse embryonic stem (ES) cells, neural progenitor cells (NPCs), and cortical neurons (CNs). Green lines, borders of TADs. Green arrowheads, genome structure signal indicative of a persistent looping interaction in ensemble Hi-C maps. (B) 3-D genome folding can be represented as a network where nodes correspond to bins of DNA and edges correspond to bin-bin interaction frequencies. Interaction frequency heatmaps of genome folding can be represented as adjacency matrices, allowing tools from graph theory and network science to be readily applied. Blue lines represent TAD boundaries. (C,D) To test for the possible presence of core-periphery structure created by looping interactions within TADs, we computed the core-periphery quality index Q for all true TADs compared to pseudo-TADs generated by choosing size-matched genomic regions at random. A Kolmogorov–Smirnov test was used to compare Q values for TADs vs. randomly placed, size-matched genomic regions in ES cells, NPCs, and CNs.

