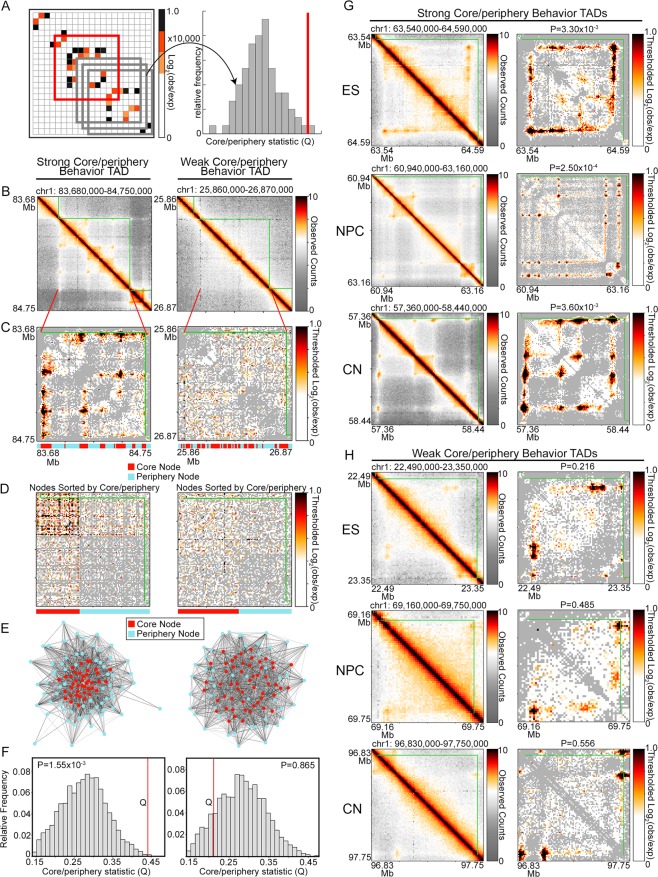
Figure 2.
A subset of genome-wide TADs exhibit significant core-periphery network structure. (A) A TAD’s core-periphery test statistic Q (red) is compared to a null distribution of Q values from 10,000 randomly placed windows of equal size on the same chromosome (gray). The one-tailed empirical p-value is calculated as the percentage of random Q values greater than or equal to the real TAD Q value. (B) Observed heatmaps of a strong (left column) and weak (right column) core-periphery TAD in embryonic stem cells. (C) Observed/Expected heatmaps for TADs in panel (B) with negative interaction scores thresholded to 0. Thresholded values are shown in gray. Locations of core and periphery nodes are shown below each heatmap. (D) Observed/Expected heatmaps from panel (C) sorted to align all core-core edges at the top left and all periphery-periphery edges at the bottom right. Locations of core and periphery nodes are shown below each heatmap. (E) Kamada-Kawai force-directed graph visualizations of the TADs in panel (C). Nodes are colored according to their core-periphery classification. Red, core. Blue, periphery. (F) Null distribution and test statistic for each respective TAD in panel (C). (G-H) Observed heatmaps of TADs exhibiting (G) strong, significant and (H) weak core-periphery behavior in each cell type. Empirical p-values are listed on each Observed/Expected heatmap.

