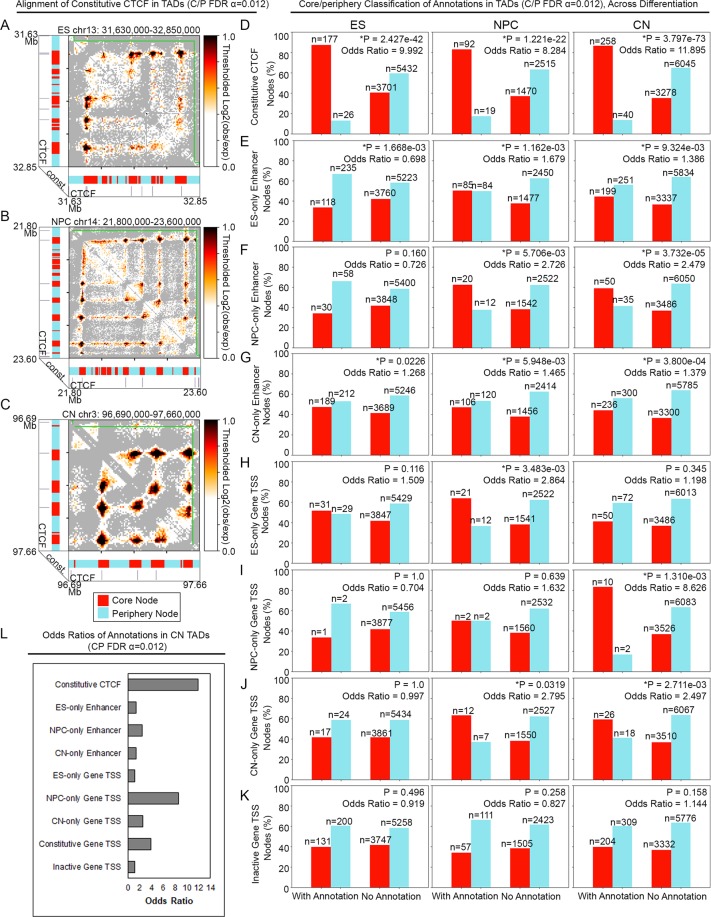
Figure 4.
Constitutive and cell-specific CTCF occupied sites are strongly enriched at core vs. periphery nodes across cell types. (A–C) Observed/Expected heatmap examples in (A) ES cell (B) NPC and (C) CN TADs with significant core-periphery architecture illustrating co-localization of constitutive CTCF occupancy with core nodes and not with periphery nodes. (D–K) Bar plots comparing proportions of core and periphery nodes that intersect the annotation of interest vs. do not intersect the annotation of interest. Odds ratios (OR) are reported for all plots. (D) Constitutive CTCF, (E) ES-only enhancers, (F) NPC-only enhancers, (G) CN-only enhancers, (H) ES-only genes, (I) NPC-only genes, (J) CN-only genes, (K) Inactive genes. (L) Summary of Odds ratios for 1-D Epigenome annotation enrichment in core vs. periphery nodes for all TADs with significant core-periphery structure in cortical neurons.

