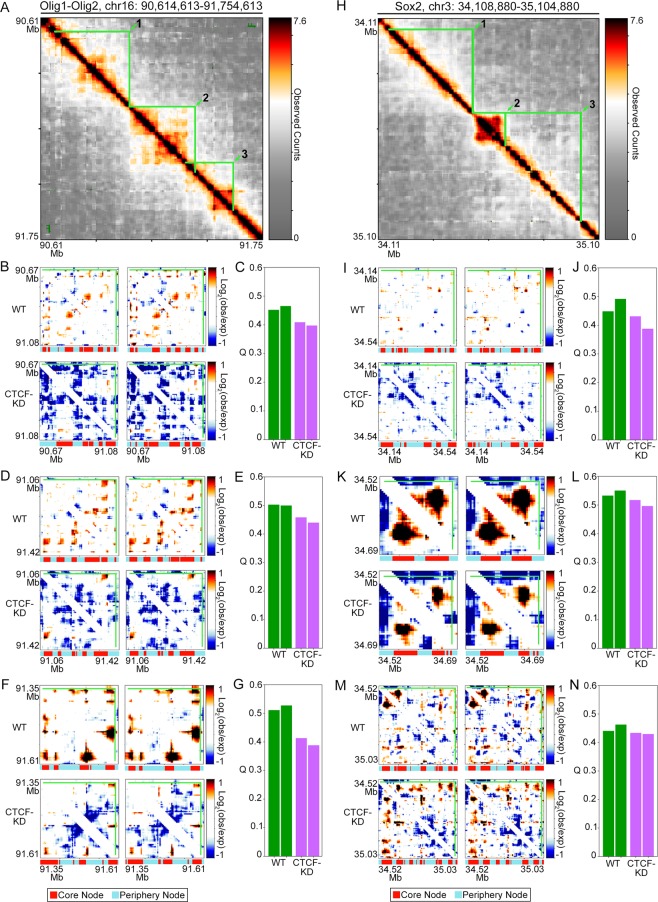
Figure 6.
Knockdown of CTCF levels in ES cells results in decreased core-periphery network structure in subTADs around pluripotency genes. (A) Observed heatmap of Chromosome-Conformation-Capture-Carbon-Copy data around the Olig1 and Olig2 genes in ES cells. The three Olig1-Olig2 subTADs used in subsequent core-periphery analysis are outlined in green and labeled 1 (B,C), 2 (D,E), and 3(F,G). (B,D,F) Observed/Expected heatmaps of Olig1-Olig2 (B) subTAD 1, (D) subTAD 2, and (F) subTAD3 in two wild type ES cell replicates (to row) and two CTCF knock down ES cell replicates (bottom). (C,E,G) Core-periphery test statistic Q for (C) subTAD 1, (E) subTAD 2, and (G) subTAD3. (H) Observed heatmap of Chromosome-Conformation-Capture-Carbon-Copy data around the Sox2 gene in ES cells. The three Sox2 subTADs used in subsequent core-periphery analysis are outlined in green and labeled 1 (I,J), 2 (K,L), and 3(M-N). (I,K,M) Observed/Expected heatmaps of Sox2 (I) subTAD 1, (K) subTAD 2, and (M) subTAD3 in two wild type ES cell replicates (to row) and two CTCF knock down ES cell replicates (bottom). (J,L,N) Core-periphery test statistic Q for (J) subTAD 1, (L) subTAD 2, and (N) subTAD3. Core and periphery nodes are labeled under each heatmap.

