Fig. 3.
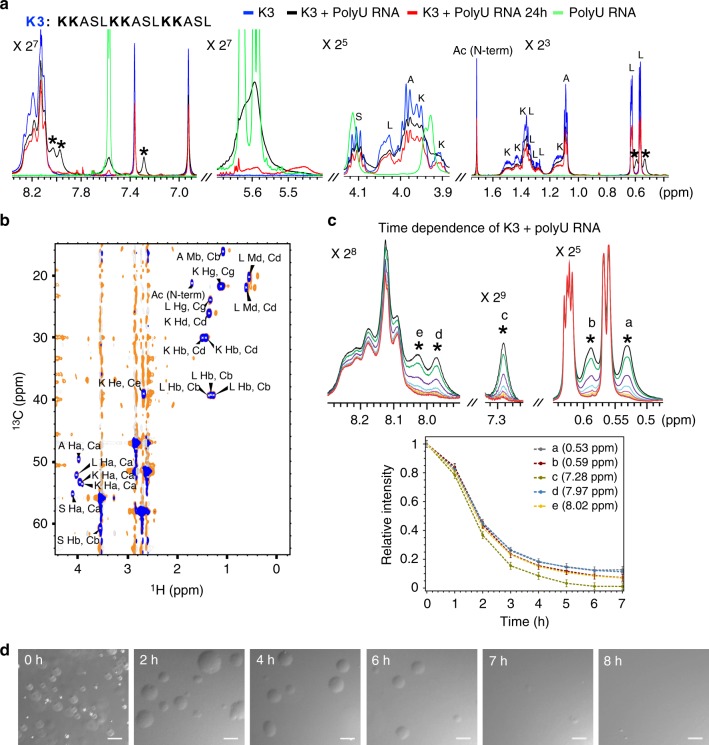
NMR spectroscopy and temporal stability of lysine-driven condensation. a 1D 1H NMR spectra of the lysine-rich peptide K3 (1 mM; blue), K3 with polyU RNA forming liquid droplets (1 mM K3 and 1 mg ml−1 polyU RNA; black) and the same sample after 24 h (red), as well as polyU RNA alone (1 mg ml−1; green). Peptide NMR signals, which are characteristic for the interaction with polyU RNA, are marked with asterisks. b 2D 1H−13C HSQC NMR spectrum of K3 (blue) and K3 with polyU RNA (orange). Cross-peaks were labeled according to amino acid-specific chemical shift values. The two K3/RNA-specific NMR signals at 1H frequencies of 0.53 and 0.59 ppm (marked with asterisks in a) were also present in the 2D 1H-13C HSQC NMR spectrum and have identical 13C chemical shifts as the two leucine Cδ resonances of K3 in the absence of polyU RNA. c Temporal stability of K3 droplets as monitored by the time-dependent decrease of NMR signals. (Top) 1D 1H NMR spectra of K3 at 0, 1, 2, 3, 4, 5, 6, and 7 h with K3/RNA-specific signals labeled from a–e. (Bottom) Time-dependent decrease in normalized signal intensity of K3/RNA-specific signals. Error bars are based on signal-to-noise ratios in the NMR spectra. The peptide solution became clear after ~ 7 h. d DIC micrographs of a sample containing K3 (1 mM) and polyU RNA (1 mg ml−1) over a period of 8 h. Liquid droplets disappeared after about 7–8 h. Scale bar, 10 μm

