
Fig. 5.
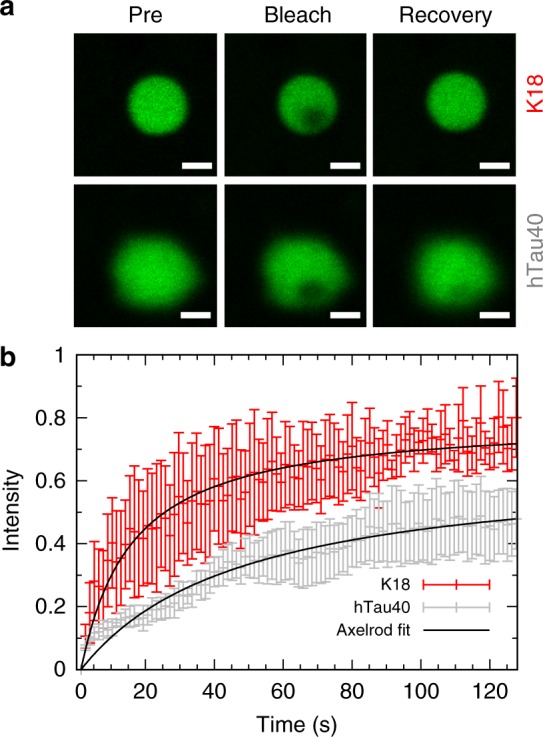
Dynamics of tau in tau/RNA droplets. a FRAP images (recovery image 129 s after bleaching; scale bar 1 μm). b Normalized FRAP recovery curves for hTau40 (50 µM; gray) and K18 (50 µM; red) droplets in the presence of 40 µg ml−1 polyU RNA (25 mM HEPES, pH 7.4). Symbols with error bars depict experimental results; black lines are fits assuming diffusion-controlled recovery (i.e., the Axelrod model). Error bars in b correspond to ± SD. Source data are provided as a Source Data file