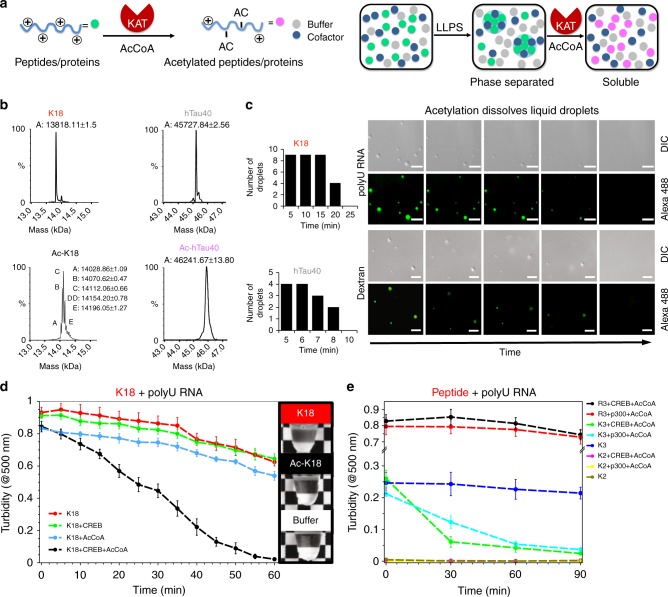
Fig. 6.
Acetylation reverses lysine-driven coacervation. a Cartoon representation illustrating acetylation of lysine-rich polypeptides by lysine acetyltransferase (KAT) in the presence of acetyl-Coenzyme A (AcCoA) (left) and its influence on lysine/RNA coacervation (right). b Mass spectra of K18 and hTau40 samples before (top) and after acetylation by CREB (bottom). Identified masses (in Da) are indicated. c DIC and fluorescence images show dissolution of K18/RNA (top; 50 µM K18, 125 µg ml−1 polyU RNA in 25 mM HEPES, pH 7.4) and hTau40/dextran (bottom; 50 µM hTau40, 10% dextran in 25 mM HEPES, pH 7.4) droplets in the presence of the acetyltransferase CREB and AcCoA. Time-dependent changes in droplet numbers were quantified (left). Experiments were performed three times for each protein sample. d, e Turbidity measurements of K18 (50 µM; d), as well as arginine- (R3; 1 mM) and lysine-rich (K2 and K3; 1 mM) peptides (e), which underwent LLPS through addition of polyU RNA (125 µg ml-1 for K18, 0.5 mg ml-1 for the peptides), in the presence of either CREB/p300 or AcCoA, or both the enzyme and AcCoA. In the middle, photographs of the respective K18 samples after 60 min are depicted. Reported values represent an average of three independent samples. Error bars in d and e correspond to ± SD. Source data are provided as a Source Data file

