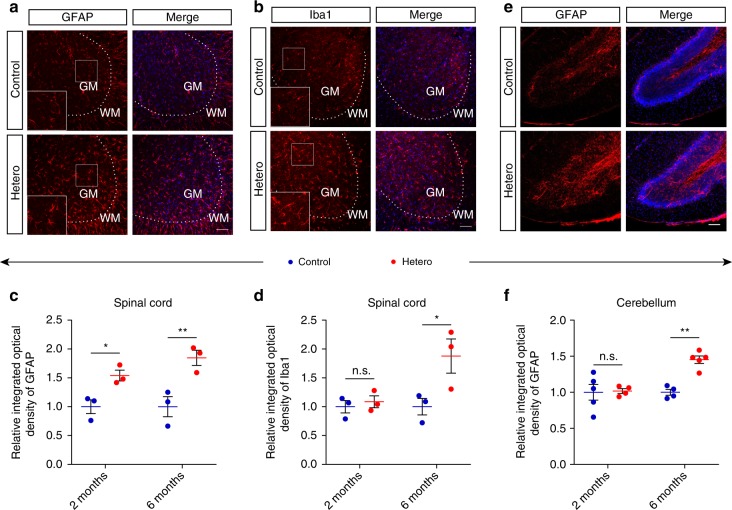
Fig. 6.
Gliosis in the lumbar spinal cord and cerebellum of GFP-PR28 heterozygous mice. a Representative images showing the numbers of GFAP-positive astrocytes in the lumbar spinal cord of 6-month-old control and GFP-PR28 heterozygous mice. GM (gray matter), WM (white matter). White squares are enlarged views of corresponding images. GFAP (red), Hoechst (blue). Scale bar represents 100 μm. b Representative images showing the numbers of Iba1-positive microglia in the lumbar spinal cord of 6-month-old control and GFP-PR28 heterozygous mice. GM (gray matter), WM (white matter). White squares are enlarged views of corresponding images. Iba1 (red), Hoechst (blue). Scale bar represents 100 μm. c Relative integrated optical density of GFAP in the lumbar spinal cord of control and heterozygous mice at 2 and 6 months of age. Two-way ANOVA, Bonferroni post hoc test; 2 months, n = 3, 3 mice; 6 months, n = 3, 3 mice. d Relative integrated optical density of Iba1 in the lumbar spinal cord of control and heterozygous mice at 2 and 6 months of age. Two-way ANOVA, Bonferroni post hoc test; 2 months, n = 3, 3 mice; 6 months, n = 3, 3 mice. e Representative images showing the numbers of GFAP-positive astrocytes in the cerebellum of 6-month-old control and GFP-PR28 heterozygous mice. GFAP (red), Hoechst (blue). Scale bar represents 100 μm. f Relative integrated optical density of GFAP in the cerebellum of control and heterozygous mice at 2 and 6 months of age. Two-way ANOVA, Bonferroni post hoc test; 2 months, n = 5, 4 mice; 6 months, n = 4, 5 mice. All data are displayed as mean ± s.e.m. *P < 0.05, **P < 0.01, n.s. not significant

