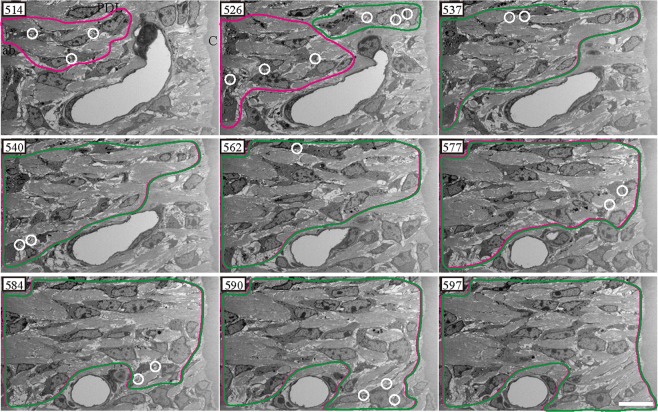
Figure 3.
Serial cross-sections imaged using focused ion beam/scanning electron microscopy tomography for the experimental group in horizontal fibre area. White circles and ellipses represent regions of intercellular contact. Magenta and green regions represent regions of cell contact with other cells. In serial cross-sections, regions of the cells in direct contact with surrounding cells overlapped. The region of intercellular contact was large, ranging from the bone to the cementum. Magenta and green regions in slices 514–526 are separate areas. The two areas in slice 537 are overlapping and the overlapping region is expanded. ab, alveolar bone; PDL, periodontal ligament; c, cementum. Scale bars: 10 μm.

