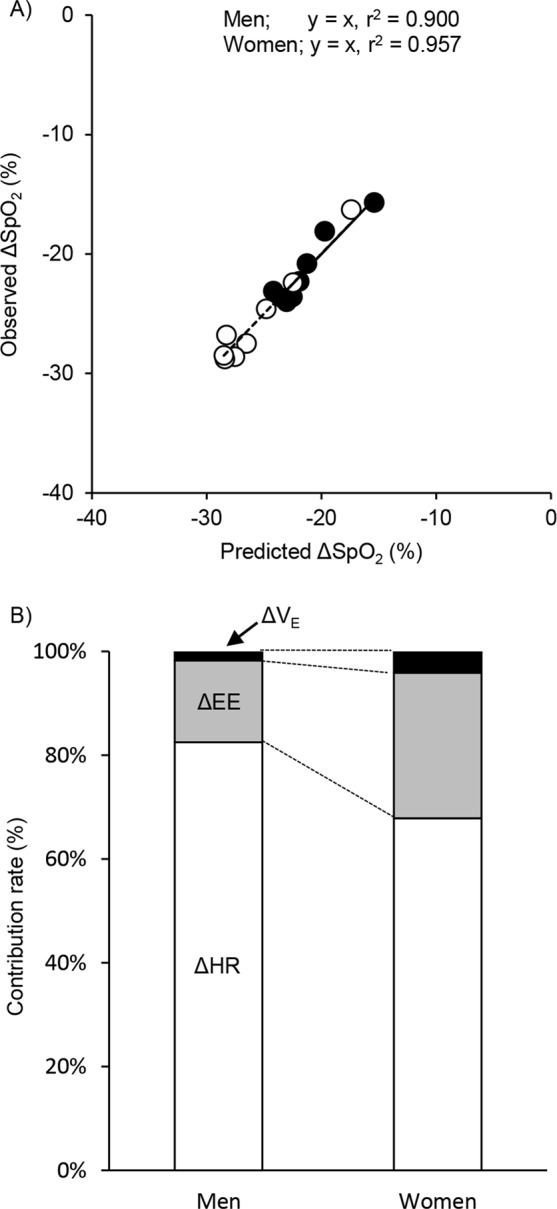
Figure 2.

Observed ΔSpO2 plotted against that predicted ΔSpO2 from the least squares regression after logarithmic transformation for ΔEE, Δ, and ΔHR: ΔSpO2 = −3.78ΔEE − 0.48ΔVE − 13.45ΔHR for men and ΔSpO2 = −9.18ΔEE + 1.64ΔVE − 14.21ΔHR for women; see text (upper panel). Line indicates y = x. Each symbol are the same as in Fig. 2. Contributions of EE (gray segments), (black segments) and HR (white segments) to predict changes in SpO2 are shown (lower panel).
