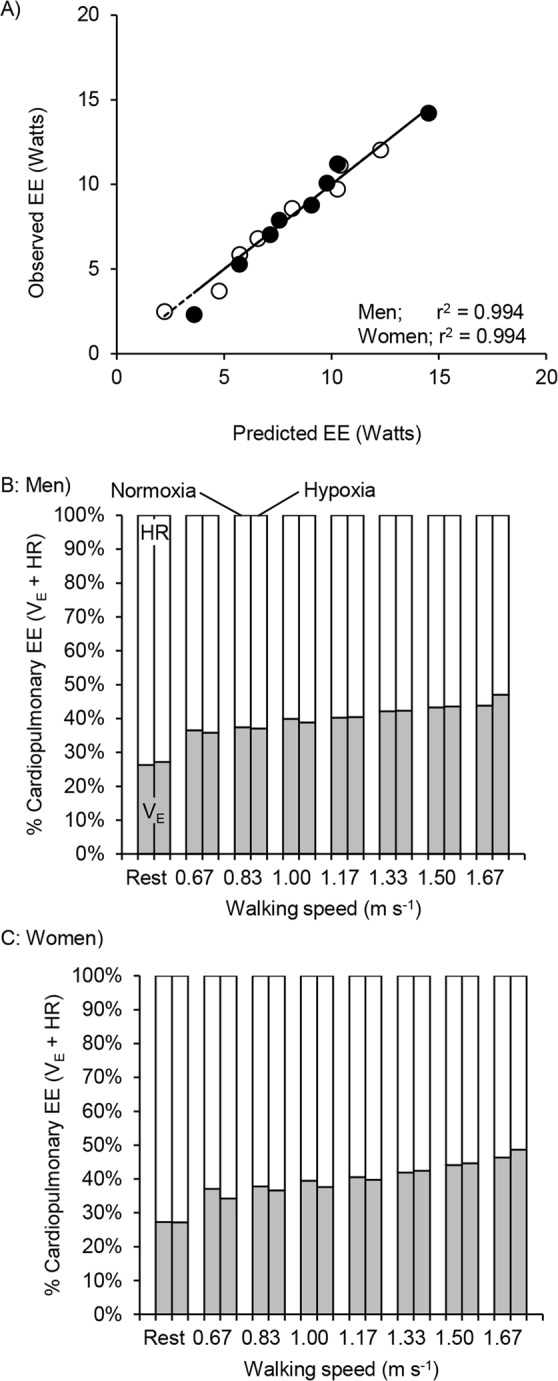
Figure 4.

Observed ΔEE plotted against that predicted ΔEE from the least squares regression with and HR: ΔEE = 0.564Δ + 0.222ΔHR for men and ΔEE = 0.613Δ + 0.190ΔHR for women; see text (panel A). Line indicates y = x. Each symbol and line are the same as in Fig. 2. Contributions of (gray segments) and HR (white segments) to cardiopulmonary energy expenditure at rest and each walking speed under normoxia and hypoxia conditions between men (panel B) and women (panel C).
