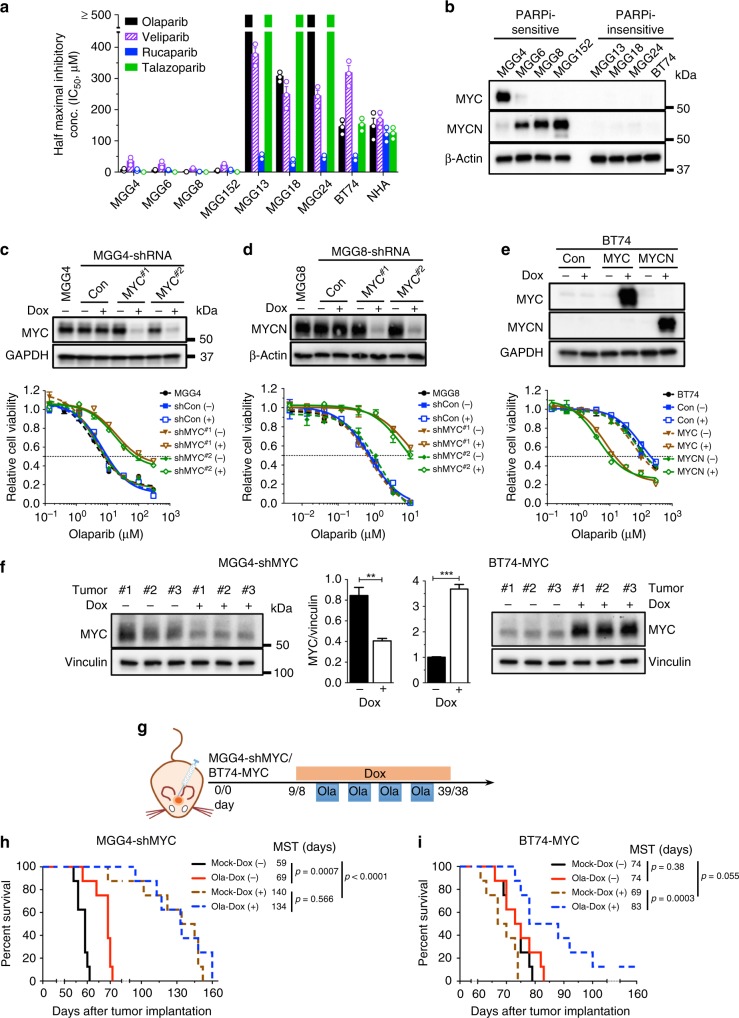
Fig. 1.
MYC/MYCN overexpression induces poly(ADP-ribose) polymerase inhibitor (PARPi) sensitivity in glioblastoma stem-like cells (GSCs). a Half maximal inhibitory concentration (IC50) of PARPis. GSCs were treated with the indicated PARPis for 6 days and cell viability was measured. Error bars depict mean ± SEM from three independent experiments in triplicate. b Representative western blot (n = 3) for the expression of MYC and MYCN in PARPi-sensitive and PARPi-resistant GSCs. β-Actin was the loading control. Proteins are listed on the left, molecular weight markers are indicated to the right. c–e Effect of MYC/MYCN knockdown or overexpression on PARPi sensitivity. (upper) Representative western blots (n = 3) showing doxycycline (Dox)-inducible MYC and MYCN knockdown (c, d; two independent short hairpin RNA sequences) or expression (e). Cells induced with (+) or without (−) Dox (1 μg/ml) for 4 days. Con scrambled sequence or empty vector control. GAPDH or β-Actin was the loading control. (lower) Olaparib dose–response curves (cell viability) for GSCs. Cells treated with olaparib in the presence (+) or absence (−) of Dox for 6 days, followed by MTS assay. Data normalized to relevant control and mean ± SEM, three independent experiments performed in triplicate. f Western blots showing MYC knockdown in MGG4-shMYC#1 (left) and overexpression in BT74-MYC (right) intracerebral xenografts treated with (+) or without (−) Dox (1 mg/ml) for 10 days. Vinculin was the loading control. (Center) Quantification of the MYC levels from western blots. Mean ± SEM. **p < 0.01, ***p < 0.001, t test. g Treatment schedule for h, i. Dox (1 mg/ml) was given from 3 days before to 3 days after olaparib (Ola, 50 mg/kg, 4 cycles), with days listed for MGG4-shMYC and BT74-MYC, respectively. h, i Kaplan–Meier survival curves of mice bearing orthotopic MGG4-shMYC#1 (h) or BT74-MYC (i) xenografts treated with Ola or vehicle (Mock) in the presence (+) or absence (−) of Dox as in g. MST median survival time. Vertical lines indicate p value comparisons (log-rank test)

