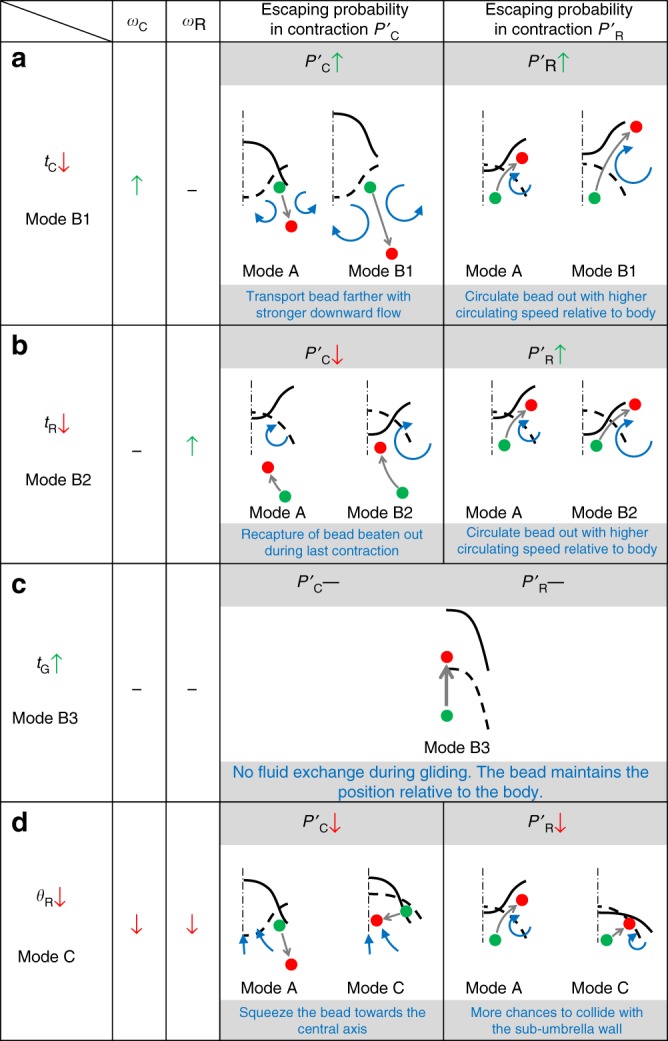
Fig. 6.

The mechanisms of changing the escaping probability by changing the robot’s kinematic parameters. The comparisons between Modes B1, B2, B3, and C with Mode A are shown in a-d, respectively. The green up arrow, the red down arrow, and the black line indicate, respectively, the increase, decrease, and no change in kinematic parameter value or probability. The dashed and solid curves indicate, respectively, the positions of the robot body at the last and the current phases. The green and red dots indicate, respectively, the positions of the object at the last and the current phases
