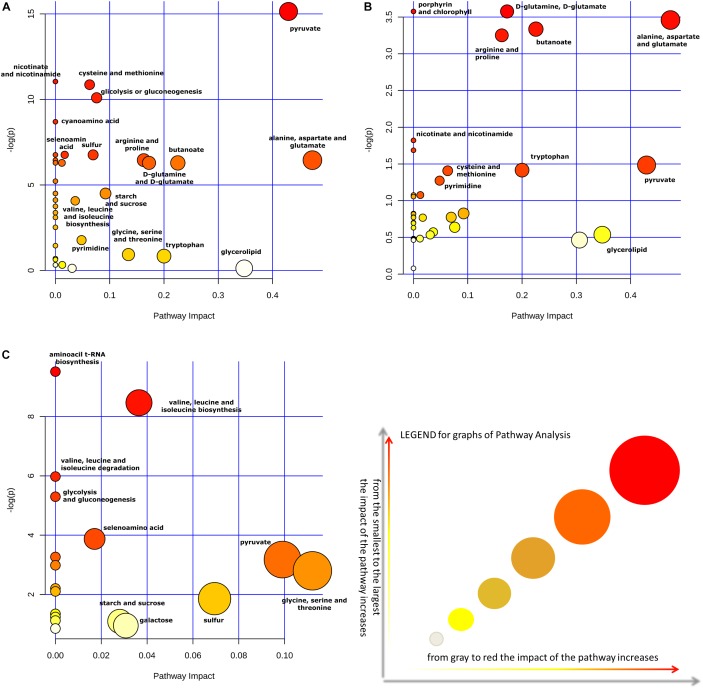
FIGURE 4.
The metabolome view shows all matched pathways, according to the p-values, from the pathway enrichment analysis, and pathway impact values from the pathway topology analysis. Impact of pathways on Lactobacillus metabolism in presence (A) or absence (B) of the supplement glycerol in the medium. Panel (C) show the impact of pathways considering only the metabolites found in greater quantity in the CFSs. All analyses of metabolite cycles were carried out using Metaboanalyst software (http://www.metaboanalyst.ca). The most significant biochemical pathways were represented with circles in different colors and sizes. In particular, smaller circles or circles in lighter colors (white < gray) indicated that the metabolite is not in the data and it is also excluded from enrichment analysis; larger circles or circle in darker colors (yellow < orange < red) indicated higher-impact metabolic pathways.

