FIGURE 2.
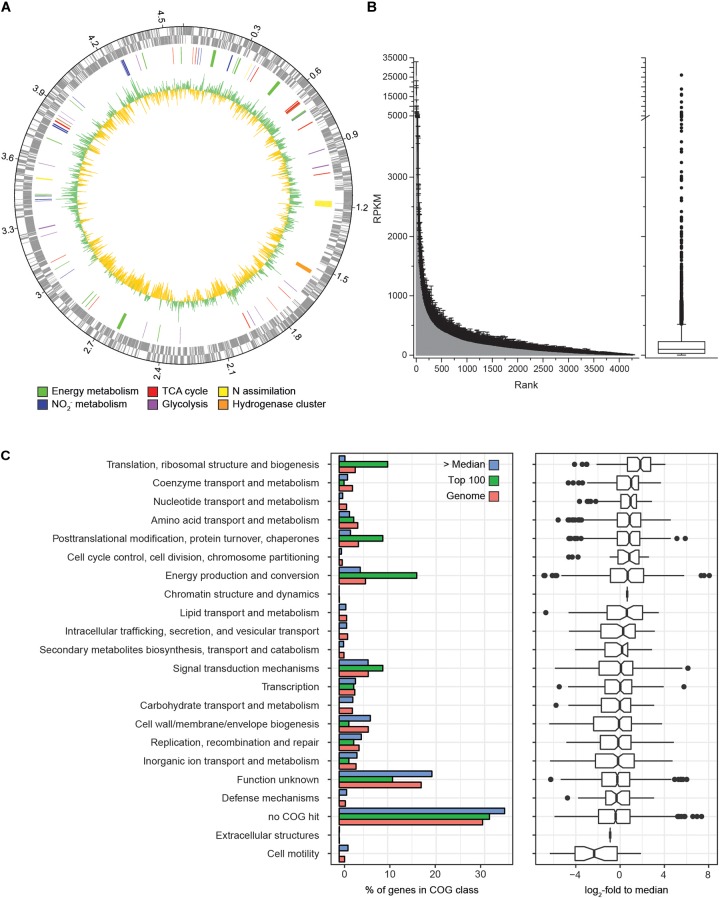
Genome-wide gene expression profile of N. moscoviensis during growth on nitrite. (A) From outside to inside, the rings show CDS in forward and reverse direction, selected CDS colored by metabolic categories and average gene expression levels (n = 3, with three technical replicates each) in log2-fold to median, with green representing transcription above and yellow below the median. (B) Average gene expression of all 4391 CDS in RPKM over three time points, with unidirectional error bars indicating standard deviation of three technical replicates. The median, 25th, and 75th percentiles are visualized in a box plot, with whiskers presenting 1.5 times the interquartile range. (C) Gene expression profiles sorted by COG functional categories. The left panel shows the percentage of genes falling within each category for all genes (red bars), among the 100 most highly transcribed CDS (green bars) and among all CDS expressed above median (blue bars). The right panel shows the expression data in log2-fold to median with 25th and 75th percentiles visualized in a box plot with whiskers presenting 1.5 times the interquartile range.

