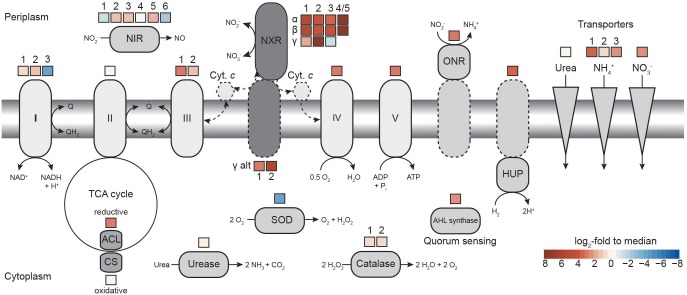
FIGURE 3.
Comparison of transcription levels of selected metabolic features in N. moscoviensis. The expression level in log2-fold to median is indicated for each gene copy encoding the respective enzyme, for multi-subunit enzyme complexes average expression levels are shown. Dashed lines indicate putative features. Respiratory complexes are labeled in roman numerals. ACL, ATP-citrate lyase; AHL, acyl-homoserine-lactone; CS, citrate synthase; Cyt., cytochrome; HUP, group 2a [NiFe] hydrogenase; NIR, NO-forming nitrite reductase; NXR, nitrite oxidoreductase; ONR, octaheme nitrite reductase; and SOD, superoxide dismutase. For further details, please refer to the text and Supplementary Table S1.

